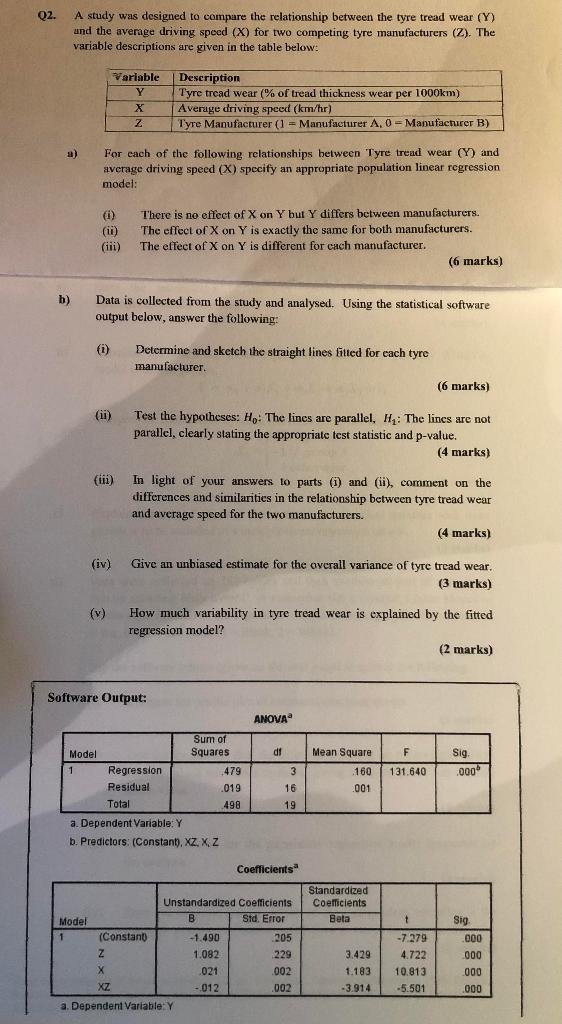
Question: Q2. A study was designed to compare the relationship between the tyre tread wear (Y) und the average driving speed (X) for two competing tyre

Q2. A study was designed to compare the

Q2. A study was designed to compare the relationship between the tyre tread wear (Y) und the average driving speed (X) for two competing tyre manufacturers (2). The variable descriptions are given in the table below: Variable Y X Z Description Tyre tread wear (% of tread thickness wear per 1000km) Average driving speed (km/hr) Tyre Manufacturer (1 - Manufacturer A. 0= Manufacturer B) For each of the following relationships between Tyre tread wear (Y) and average driving speed (X) specify an appropriate population linear regression model: (1) () in (ii) There is no effect of X on Y bul Y differs between manufacturers. The effect of X on Y is exactly the same for both manufacturers. The effect of X on Y is different for each manufacturer. (6 marks) b) ) Data is collected from the study and analysed. Using the statistical software output below, answer the following: (1) Determine and sketch the straight lines fitted for each tyre manufacturer (6 marks) (11) Test the hypotheses: Ho: The lines are parallel, H: The lines are not parallel, clearly stating the appropriate test statistic and p-value. (4 marks) (iii) In light of your answers to parts (1) and (ii), comment on the differences and similarities in the relationship between tyre tread wear and average speed for the two manufacturers. (4 marks) (iv) Give an unbiased estimate for the overall variance of tyre tread wear. (3 marks) (v) How much variability in tyre tread wear is explained by the fitted regression model? (2 marks) Software Output: ANOVA dt F Mean Square 160 Sig .000 131.640 Sum of Model Squares 1 Regression 479 Residual .019 Total 498 a. Dependent Variable: Y b. Predictors: (Constant, XZ, XZ 3 16 19 001 Coefficients Standardized Coefficients Beta t Unstandardized Coefficients Model B Sid. Error 1 (Constant -1.490 205 Z 1.082 229 X 021 002 XZ - 012 .002 a. Dependent Variable: Y Sig .000 000 3.429 1.183 -3.914 -7.279 4.722 10.813 -5.501 000 000 Q2. A study was designed to compare the relationship between the tyre tread wear (Y) und the average driving speed (X) for two competing tyre manufacturers (2). The variable descriptions are given in the table below: Variable Y X Z Description Tyre tread wear (% of tread thickness wear per 1000km) Average driving speed (km/hr) Tyre Manufacturer (1 - Manufacturer A. 0= Manufacturer B) For each of the following relationships between Tyre tread wear (Y) and average driving speed (X) specify an appropriate population linear regression model: (1) () in (ii) There is no effect of X on Y bul Y differs between manufacturers. The effect of X on Y is exactly the same for both manufacturers. The effect of X on Y is different for each manufacturer. (6 marks) b) ) Data is collected from the study and analysed. Using the statistical software output below, answer the following: (1) Determine and sketch the straight lines fitted for each tyre manufacturer (6 marks) (11) Test the hypotheses: Ho: The lines are parallel, H: The lines are not parallel, clearly stating the appropriate test statistic and p-value. (4 marks) (iii) In light of your answers to parts (1) and (ii), comment on the differences and similarities in the relationship between tyre tread wear and average speed for the two manufacturers. (4 marks) (iv) Give an unbiased estimate for the overall variance of tyre tread wear. (3 marks) (v) How much variability in tyre tread wear is explained by the fitted regression model? (2 marks) Software Output: ANOVA dt F Mean Square 160 Sig .000 131.640 Sum of Model Squares 1 Regression 479 Residual .019 Total 498 a. Dependent Variable: Y b. Predictors: (Constant, XZ, XZ 3 16 19 001 Coefficients Standardized Coefficients Beta t Unstandardized Coefficients Model B Sid. Error 1 (Constant -1.490 205 Z 1.082 229 X 021 002 XZ - 012 .002 a. Dependent Variable: Y Sig .000 000 3.429 1.183 -3.914 -7.279 4.722 10.813 -5.501 000 000

Step by Step Solution

There are 3 Steps involved in it

1 Expert Approved Answer
Step: 1 Unlock blur-text-image
Question Has Been Solved by an Expert!

Get step-by-step solutions from verified subject matter experts

Step: 2 Unlock
Step: 3 Unlock

Students Have Also Explored These Related General Management Questions!