

Question: Q2. Consider the list of processes that going to execute as shown in Table 1: Table 1: List of processes going to execute Process Arrival
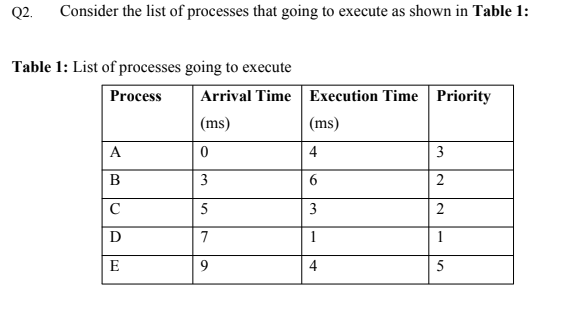
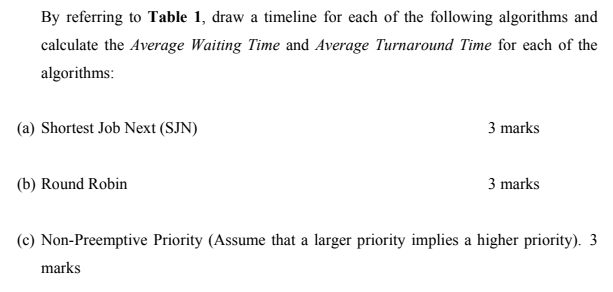
Q2. Consider the list of processes that going to execute as shown in Table 1: Table 1: List of processes going to execute Process Arrival Time Execution Time Priority (ms) (ms) A 0 4 3 B 3 6 2 5 3 2 D 7 1 1 D 5 E 4 5 By referring to Table 1, draw a timeline for each of the following algorithms and calculate the Average Waiting Time and Average Turnaround Time for each of the algorithms: (a) Shortest Job Next (SJN) 3 marks (b) Round Robin 3 marks C) Non-Preemptive Priority (Assume that a larger priority implies a higher priority). 3 marks
Step by Step Solution
There are 3 Steps involved in it
1 Expert Approved Answer
Step: 1 Unlock

Question Has Been Solved by an Expert!
Get step-by-step solutions from verified subject matter experts
Step: 2 Unlock
Step: 3 Unlock