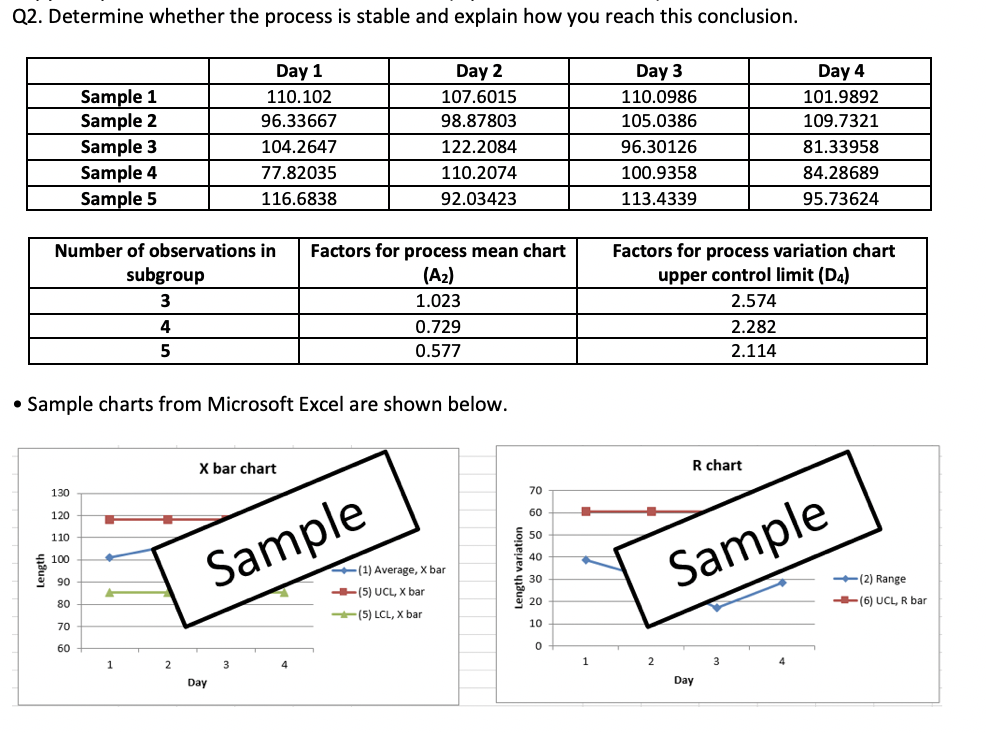
Question: Q2. Determine whether the process is stable and explain how you reach this conclusion. Sample 1 Sample 2 Sample 3 Sample 4 Sample 5 Day

Q2. Determine whether the process is stable and

Q2. Determine whether the process is stable and explain how you reach this conclusion. Sample 1 Sample 2 Sample 3 Sample 4 Sample 5 Day 1 110.102 96.33667 104.2647 77.82035 116.6838 Day 2 107.6015 98.87803 122.2084 110.2074 92.03423 Day 3 110.0986 105.0386 96.30126 100.9358 113.4339 Day 4 101.9892 109.7321 81.33958 84.28689 95.73624 Number of observations in subgroup 3 Factors for process mean chart (A2) 1.023 0.729 0.577 Factors for process variation chart upper control limit (DA) 2.574 2.282 2.114 4 5 Sample charts from Microsoft Excel are shown below. X bar chart R chart 130 70 120 60 110 50 100 40 Length Sample Length variation (1) Average, X bar (5) UCL, X bar (5) LCL, X bar Sample 90 30 (2) Range (6) UCL, R bar 80 20 70 10 60 0 1 2 Day Day

Step by Step Solution

There are 3 Steps involved in it

1 Expert Approved Answer
Step: 1 Unlock blur-text-image
Question Has Been Solved by an Expert!

Get step-by-step solutions from verified subject matter experts

Step: 2 Unlock
Step: 3 Unlock

Students Have Also Explored These Related General Management Questions!