

Question: Q2: Development & Analysis (50 points) Given the car dataset in the attachment, you need to do a visual analysis of clustering these cars. ou
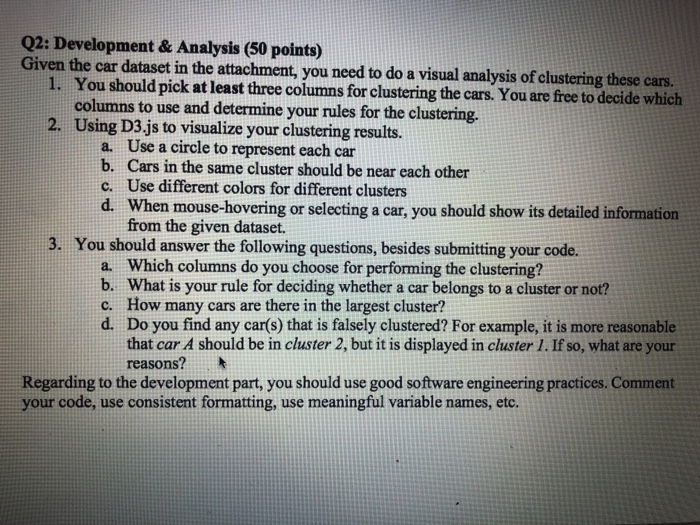
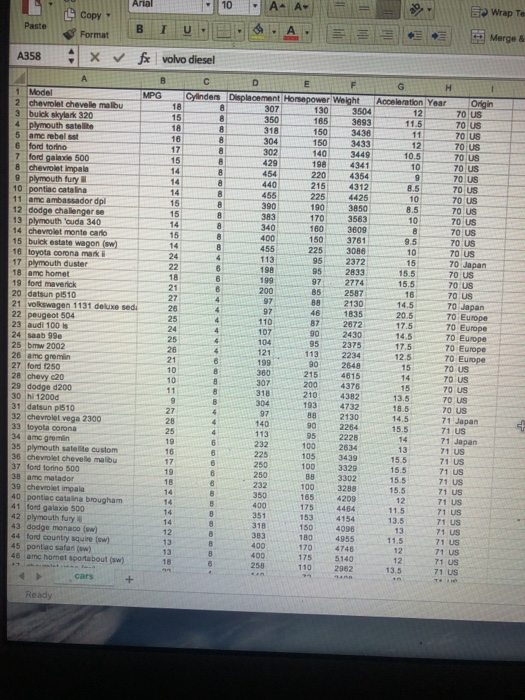
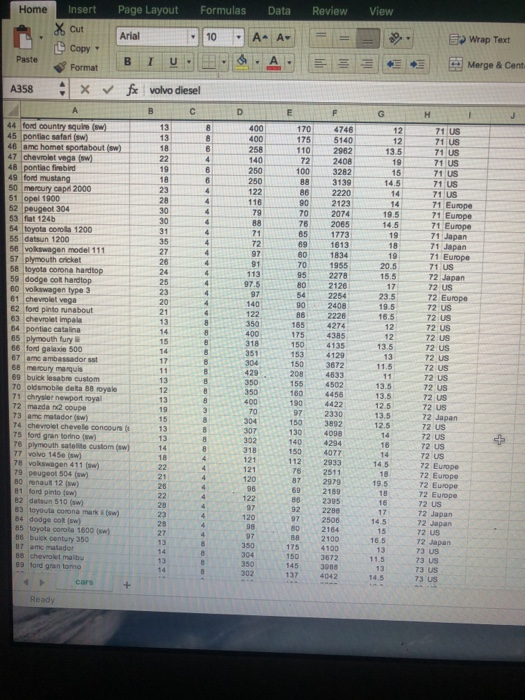
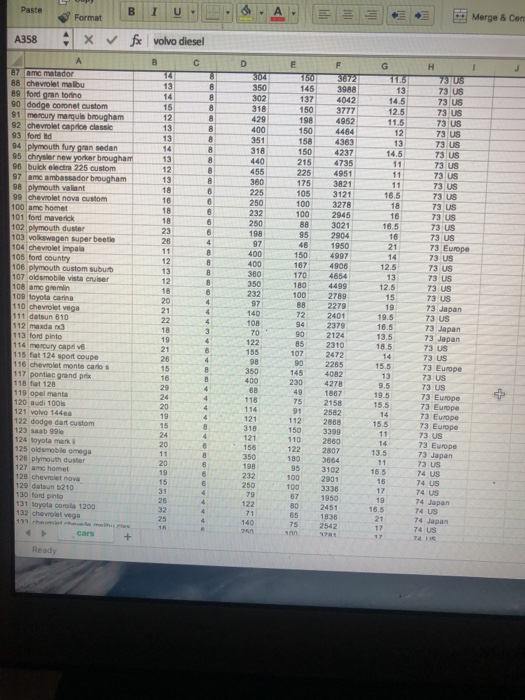
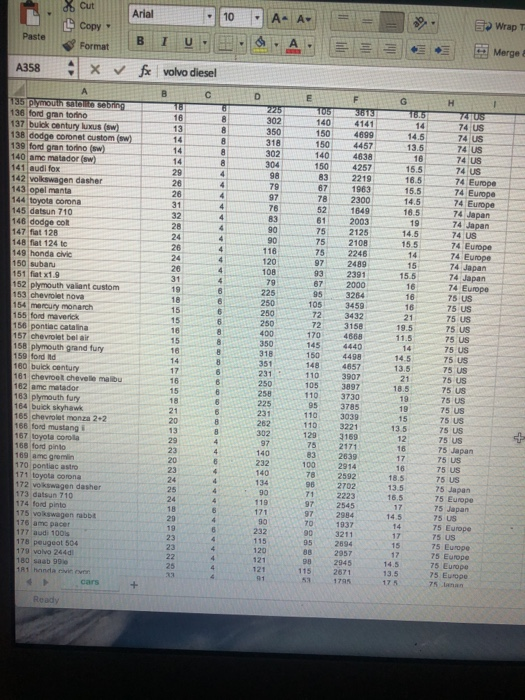
Q2: Development & Analysis (50 points) Given the car dataset in the attachment, you need to do a visual analysis of clustering these cars. ou should pick at least three columns for clustering the cars. You are free to decide which columns to use and determine your rules for the clustering 2. Using D3.js to visualize your clustering results Use a circle to represent each car b. a. Cars in the same cluster should be near each other c. Use different colors for different clusters d. When mouse-hovering or selecting a car, you should show its detailed information from the given dataset. 3. You should answer the following questions, besides submitting your code. a. Which columns do you choose for performing the clustering? b. What is your rule for deciding whether a car belongs to a cluster or not? c. How many cars are there in the largest cluster? d. Do you find any car(s) that is falsely clustered? For example, it is more reasonable that car A should be in cluster 2, but it is displayed in cluster 1. If so, what are your reasons? Regarding to the development part, you should use good software engineering practices. Comment your code, use consistent formatting, use meaningful variable names, etc. Q2: Development & Analysis (50 points) Given the car dataset in the attachment, you need to do a visual analysis of clustering these cars. ou should pick at least three columns for clustering the cars. You are free to decide which columns to use and determine your rules for the clustering 2. Using D3.js to visualize your clustering results Use a circle to represent each car b. a. Cars in the same cluster should be near each other c. Use different colors for different clusters d. When mouse-hovering or selecting a car, you should show its detailed information from the given dataset. 3. You should answer the following questions, besides submitting your code. a. Which columns do you choose for performing the clustering? b. What is your rule for deciding whether a car belongs to a cluster or not? c. How many cars are there in the largest cluster? d. Do you find any car(s) that is falsely clustered? For example, it is more reasonable that car A should be in cluster 2, but it is displayed in cluster 1. If so, what are your reasons? Regarding to the development part, you should use good software engineering practices. Comment your code, use consistent formatting, use meaningful variable names, etc
Step by Step Solution
There are 3 Steps involved in it

Get step-by-step solutions from verified subject matter experts