

Question: Q2. Planning and preparing for the unexpected, especially in response to a security incident, is one of the greatest challenges faced by information technology professionals
Q2.
Planning and preparing for the unexpected, especially in response to a security incident, is one of the greatest challenges faced by information technology professionals today. An incident is described as any violation of policy, law, or unacceptable act that involves information assets. Incident Response (IR) teams should be evaluating themselves on metrics, such as incident detection or dwell time, to determine how quickly they can detect and respond to incidents in the environment. In a recent year, an institute surveyed organizations about internal response capabilities. The frequency distribution that summarizes the average time organizations took to detect incidents is given below.
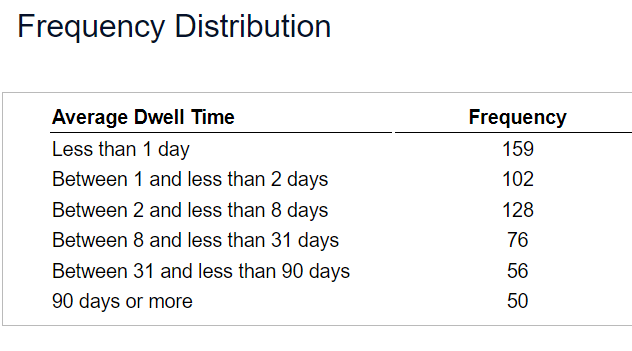
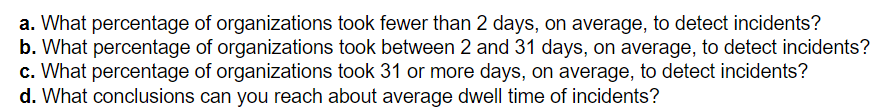
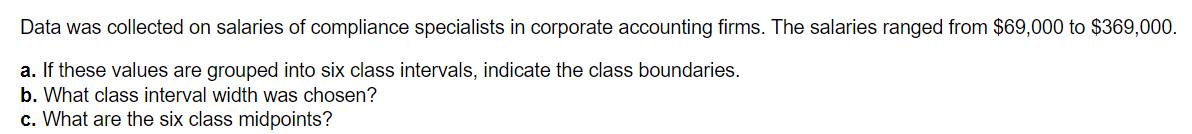
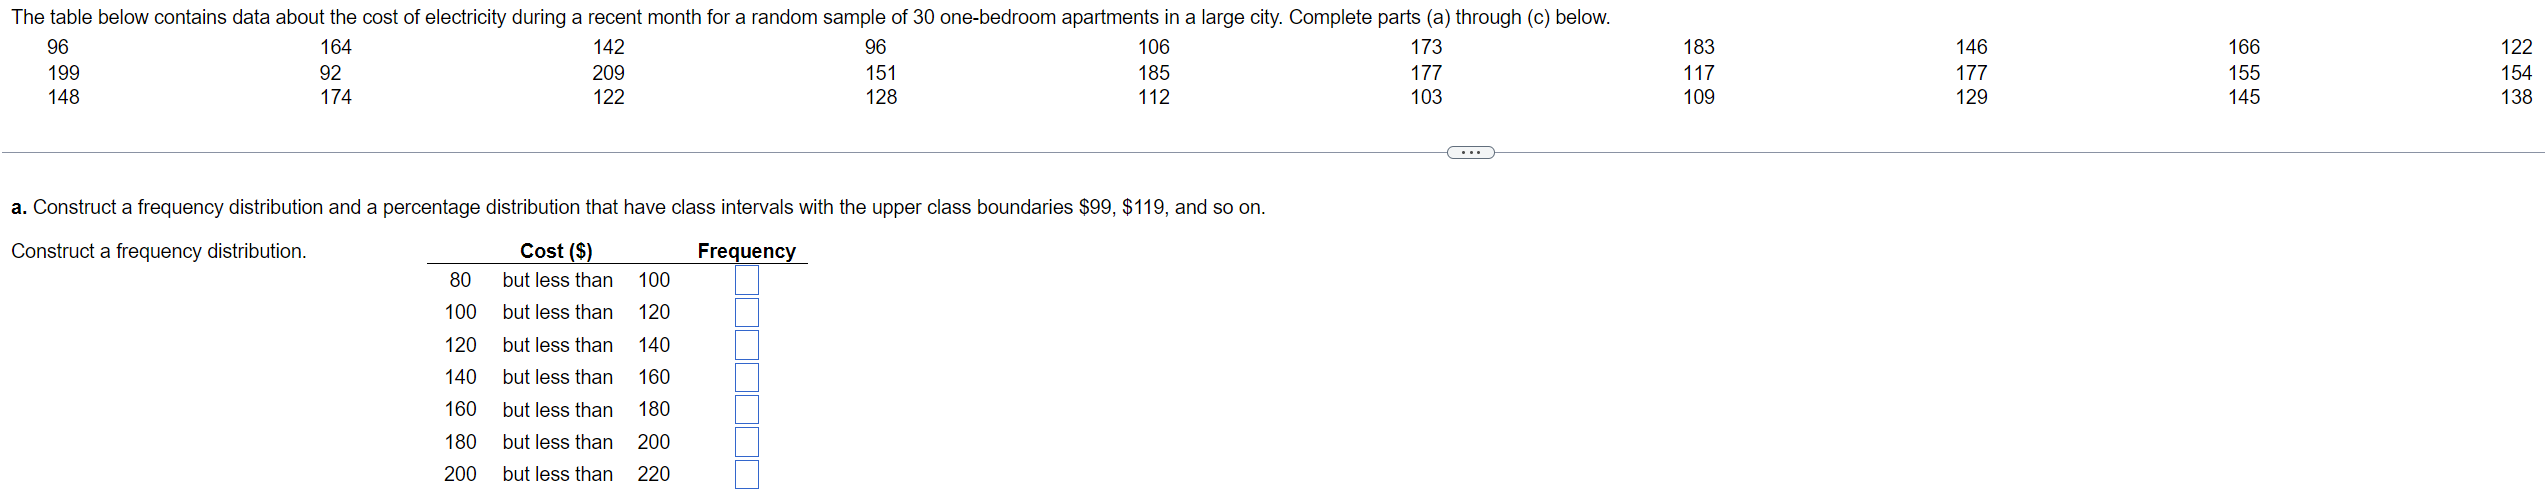

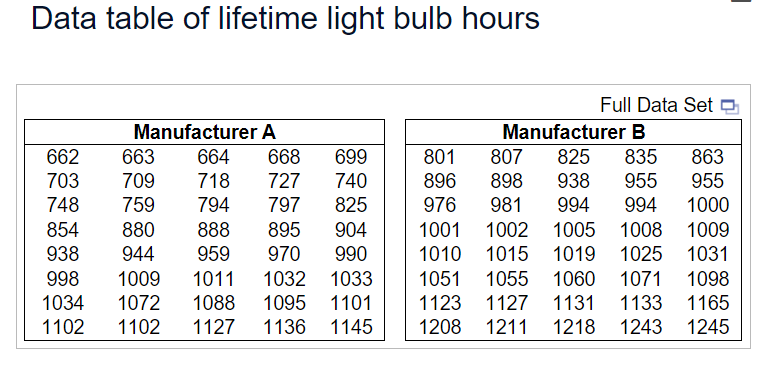
Frequency Distribution Average Dwell Time Frequency Less than 1 day 159 Between 1 and less than 2 days 102 Between 2 and less than 8 days 128 Between 8 and less than 31 days 76 Between 31 and less than 90 days o6 90 days or more o0 a. What percentage of organizations took fewer than 2 days, on average, to detect incidents? b. What percentage of organizations took between 2 and 31 days, on average, to detect incidents? c. What percentage of organizations took 31 or more days, on average, to detect incidents? d. What conclusions can you reach about average dwell time of incidents? Data was collected on salaries of compliance specialists in corporate accounting firms. The salaries ranged from $69,000 to $369,000. a. If these values are grouped into six class intervals, indicate the class boundaries. b. What class interval width was chosen? c. What are the six class midpoints? The table below contains data about the cost of electricity during a recent month for a random sample of 30 one-bedroom apartments in a large city. Complete parts (a) through (c) below. 96 164 142 96 106 173 183 146 166 122 199 92 209 151 185 177 117 177 155 154 148 174 122 128 112 103 109 129 145 138 a. Construct a frequency distribution and a percentage distribution that have class intervals with the upper class boundaries $99, $119, and so on. Construct a frequency distribution. Cost ($ Frequency 80 but less than 100 100 but less than 120 120 but less than 140 140 but less than 160 60 but less than 180 180 but less than 200 200 but less than 220a. Construct a frequency distribution and a percentage distribution. b. Construct a cumulative percentage distribution. . What conclusions can you reach concerning the average credit scores of people living in different American cities? Data table of lifetime light bulb hours Full Data Set & Manufacturer A Manufacturer B \f\f
Step by Step Solution
There are 3 Steps involved in it

Get step-by-step solutions from verified subject matter experts