

Question: Q2: Random number distributions (8 points) In this problem, you are going to visualize random number distributions, using a sideways graph of asterisks (which you
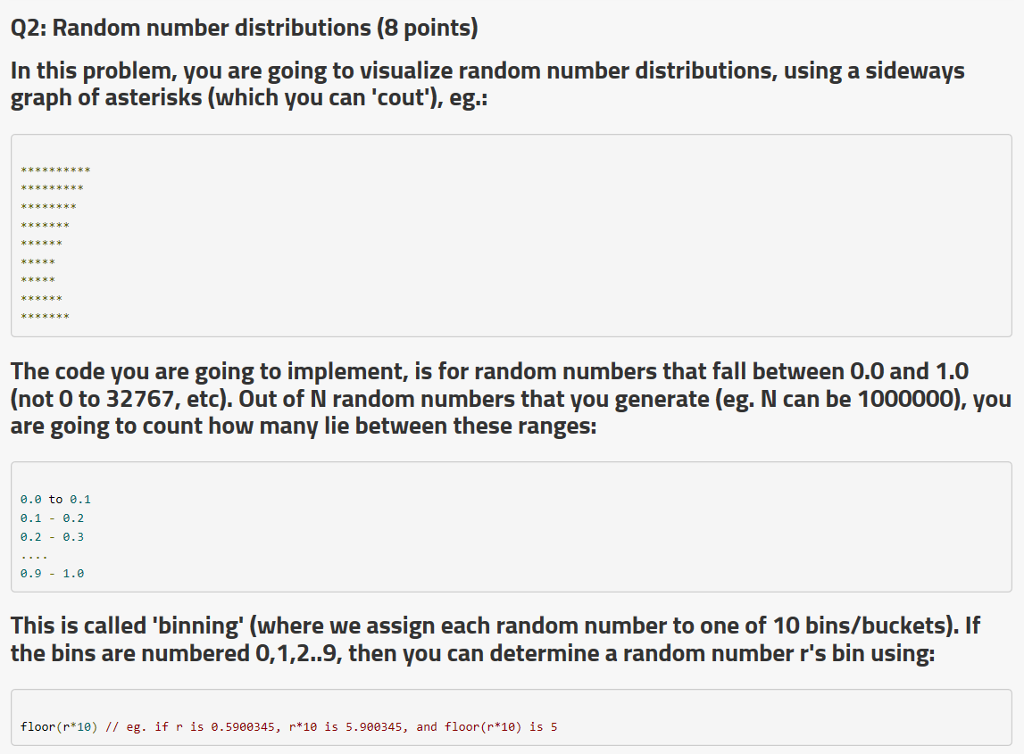
Q2: Random number distributions (8 points) In this problem, you are going to visualize random number distributions, using a sideways graph of asterisks (which you can 'cout'), eg.: The code you are going to implement, is for random numbers that fall between 0.0 and 1.0 (not 0 to 32767, etc). Out of N random numbers that you generate (eg. N can be 1000000), you are going to count how many lie between these ranges: 0.2 -0.3 This is called 'binning' (where we assign each random number to one of 10 bins/buckets). If the bins are numbered 0,1,2..9, then you can determine a random number r's bin using: floor (r*1e) 11 eg. if r is e.5980345, r10 is 5.900345, and floor(r 10) is 5
Step by Step Solution
There are 3 Steps involved in it

Get step-by-step solutions from verified subject matter experts