

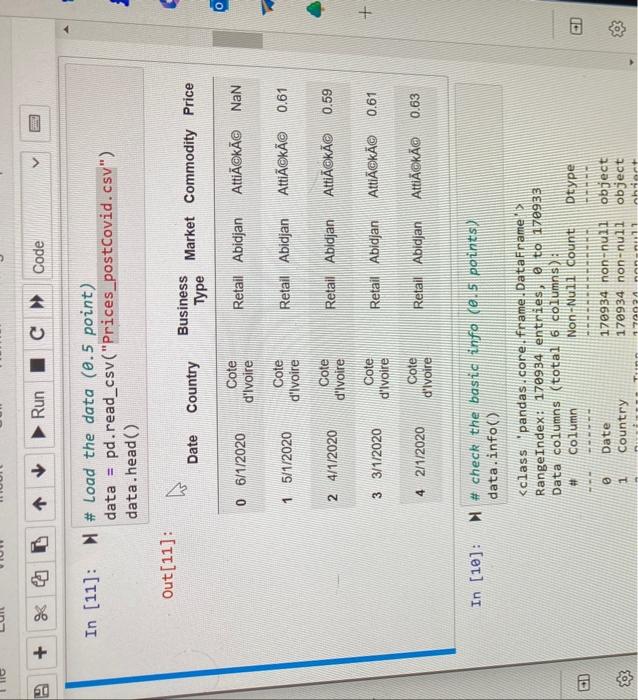
Question: Q2: remove all the special charaters in 'Commodity' (1 points) hint: option 1: use [^a-zA-Z0-9] [27]:H Out [27]: Country Business Type Market Commodity Price Q3:
![option 1: use [^a-zA-Z0-9] [27]:H Out [27]: Country Business Type Market Commodity](https://dsd5zvtm8ll6.cloudfront.net/si.experts.images/questions/2024/09/66f4619888915_79966f46197eaa2a.jpg)
![[16]: M print(data ["country"].unique()) ["Cote d'Ivoire" 'Cameroon' 'Morocco' 'Democratic Republic of the](https://dsd5zvtm8ll6.cloudfront.net/si.experts.images/questions/2024/09/66f46199d9a02_80166f461997c31c.jpg)
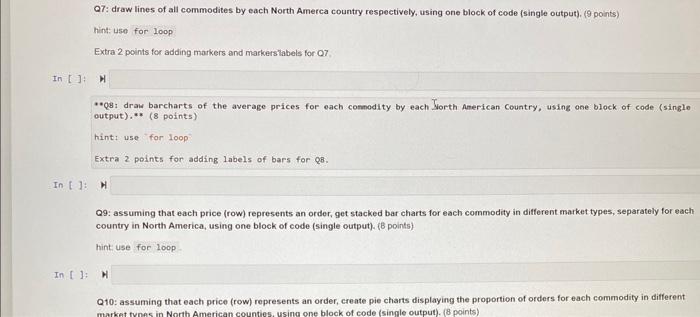
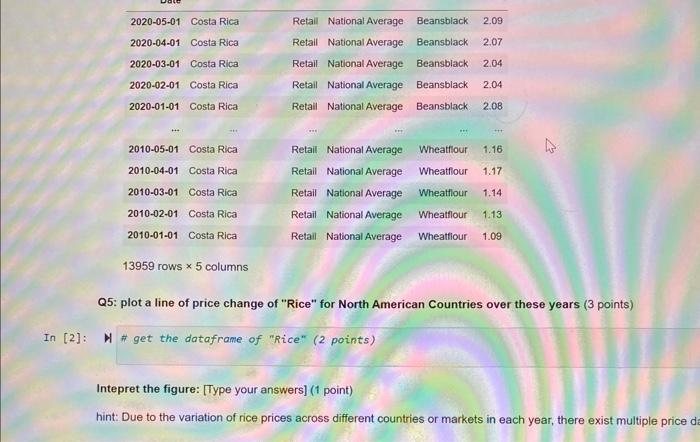
Q2: remove all the special charaters in 'Commodity' (1 points) hint: option 1: use [^a-zA-Z0-9] [27]:H Out [27]: Country Business Type Market Commodity Price Q3: check the unique values in "Country" ( 1 point) In [16]: M print(data ["country"].unique()) ["Cote d'Ivoire" 'Cameroon' 'Morocco' 'Democratic Republic of the Congo' 'Rwanda' 'Kenya' 'Costa Rica' 'United Republic of Tanzania' 'Uganda' 'Haiti' 'Dominican Republic' 'Guatemala' 'Mexico' 'Panama' 'El Salvador' 'Honduras' 'Nicaragua' 'Iraq' 'Argentina' 'Egypt' 'Azerbaijan' 'Botswana' 'Georgia' 'Kazakhstan' 'Kyrgyzstan' 'Mauritania' 'Mongolia' 'Afghanistan' 'Tajikistan' 'Russian Federation' 'South Africa' 'Tunisia' 'Bolivia' 'Chile' 'Zimbabwe' 'Israel' 'Peru' 'Brazil' 'Eswatini' 'Belarus' Q5: plot a line of price change of "Rice" for North American Countries over these years ( 3 points) [2]:M Intepret the figure: [Type your answers] ( 1 point) hint: Due to the variation of rice prices across different countries or markets in each year, there exist multiple price de Q6: get all the Rice prices for each North American country and plot the trend lines of annual Rice prices for each country on one canvas. (5 points) Markers are optional. hint: notice, this question is asking annual rice prices, you need to resample the data to annual 'A'. Q7: draw lines of all commodites by each North Amerca country respectively, using one block of code (single output), (9 points) hint: uso for 100p Extra 2 points for adding markers and markersiabels for Q7. In[];ln "Qgi draw barcharts of the average prices for each connodity by each Sorth American Country, using one block of code (singlo output), w ( 8 points) hint: use for loop Extra 2 points for adding labels of bars for 98. In [ ]: M Q9: assuming that each price (row) represents an order, get stacked bar charts for each commodity in different market types, separately for each country in North America, using one block of code (single output). (B points) hint: use for 100p In [ 1:ln Q10: assuming that each price (row) represents an order, create pie charts displaying the proportion of orders for each commodity in different Q2: remove all the special charaters in 'Commodity' (1 points) hint: option 1: use [^a-zA-Z0-9] [27]:H Out [27]: Country Business Type Market Commodity Price Q3: check the unique values in "Country" ( 1 point) In [16]: M print(data ["country"].unique()) ["Cote d'Ivoire" 'Cameroon' 'Morocco' 'Democratic Republic of the Congo' 'Rwanda' 'Kenya' 'Costa Rica' 'United Republic of Tanzania' 'Uganda' 'Haiti' 'Dominican Republic' 'Guatemala' 'Mexico' 'Panama' 'El Salvador' 'Honduras' 'Nicaragua' 'Iraq' 'Argentina' 'Egypt' 'Azerbaijan' 'Botswana' 'Georgia' 'Kazakhstan' 'Kyrgyzstan' 'Mauritania' 'Mongolia' 'Afghanistan' 'Tajikistan' 'Russian Federation' 'South Africa' 'Tunisia' 'Bolivia' 'Chile' 'Zimbabwe' 'Israel' 'Peru' 'Brazil' 'Eswatini' 'Belarus' Q5: plot a line of price change of "Rice" for North American Countries over these years ( 3 points) [2]:M Intepret the figure: [Type your answers] ( 1 point) hint: Due to the variation of rice prices across different countries or markets in each year, there exist multiple price de Q6: get all the Rice prices for each North American country and plot the trend lines of annual Rice prices for each country on one canvas. (5 points) Markers are optional. hint: notice, this question is asking annual rice prices, you need to resample the data to annual 'A'. Q7: draw lines of all commodites by each North Amerca country respectively, using one block of code (single output), (9 points) hint: uso for 100p Extra 2 points for adding markers and markersiabels for Q7. In[];ln "Qgi draw barcharts of the average prices for each connodity by each Sorth American Country, using one block of code (singlo output), w ( 8 points) hint: use for loop Extra 2 points for adding labels of bars for 98. In [ ]: M Q9: assuming that each price (row) represents an order, get stacked bar charts for each commodity in different market types, separately for each country in North America, using one block of code (single output). (B points) hint: use for 100p In [ 1:ln Q10: assuming that each price (row) represents an order, create pie charts displaying the proportion of orders for each commodity in different
Step by Step Solution
There are 3 Steps involved in it

Get step-by-step solutions from verified subject matter experts