

Question: Q2. Test a hypothesis with bivariate regression. (1 1 points) Suppose a researcher wishes to use the same data set from Q1 to answer the

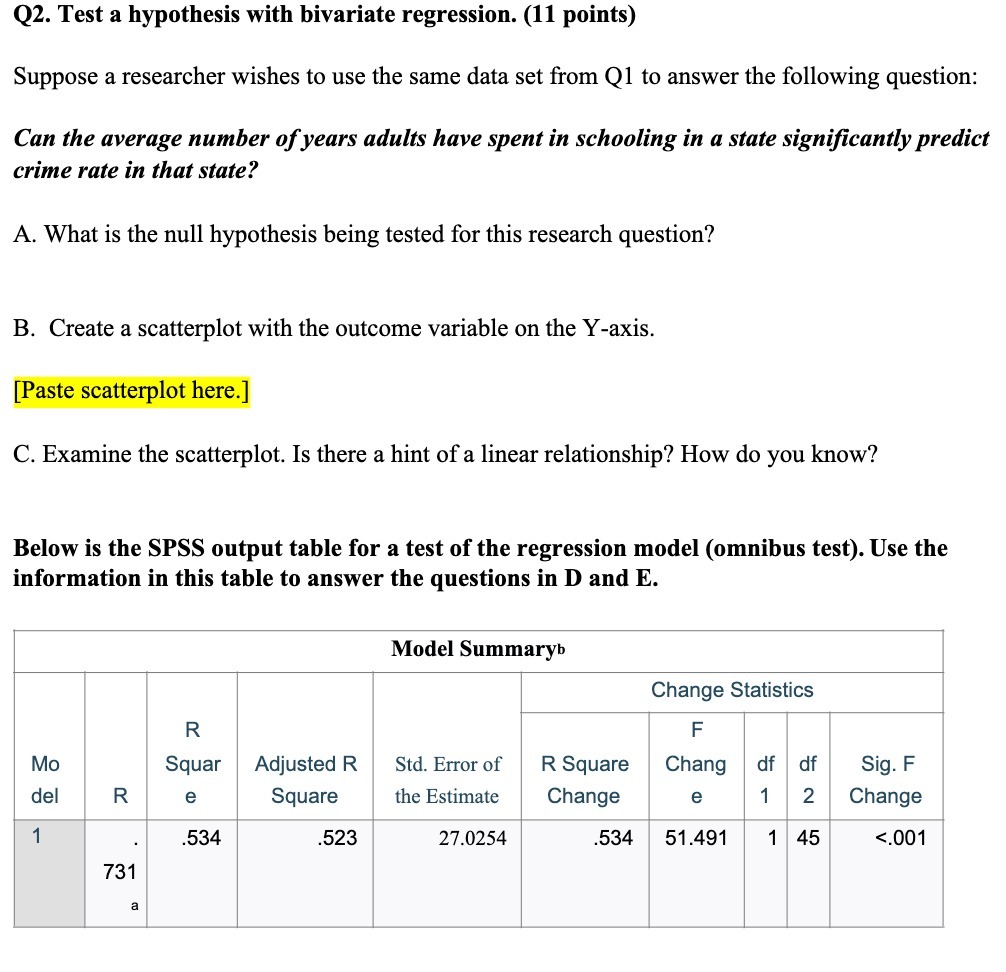
Q2. Test a hypothesis with bivariate regression. (1 1 points) Suppose a researcher wishes to use the same data set from Q1 to answer the following question: Can the average number of years adults have spent in schooling in a state significantly predict crime rate in that state? A. What is the null hypothesis being tested for this research question? B. Create a scatterplot with the outcome variable on the Yaxis. [Paste scatterplot here] C. Examine the scatteiplot. Is there a hint of a linear relationship? How do you know? Below is the SPSS output table for a test of the regression model (omnibus test). Use the information in this table to answer the questions in D and E. Model Summaryh : Change Statistics R i ' F i ' ' Mo Squar Adjusted R Std. Error of R Square Chang df df Sig. F del R e Square the Estimate Change e 1 2 Change ' 1 I .i .534 E .523 ' 27.0254 .534 ' 51.491 : 145' 4001 i 731
Step by Step Solution
There are 3 Steps involved in it

Get step-by-step solutions from verified subject matter experts