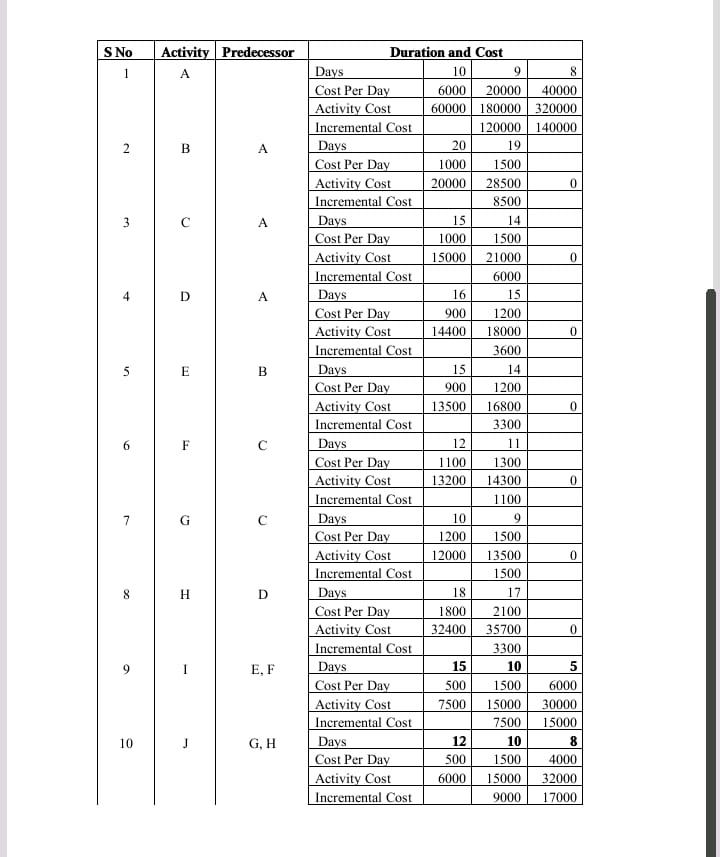
Question: Q2: Using the Data tabulated below, a. Draw network diagram (any) b. Determine the number of paths c. Determine the critical path(s) d. Determine the

Q2: Using the Data tabulated below, a. DrawQ2: Using the Data tabulated below, a. Draw

Q2: Using the Data tabulated below, a. Draw network diagram (any) b. Determine the number of paths c. Determine the critical path(s) d. Determine the associated project duration and cost e. Using the project crashing technique find out the minimum possible duration and the associated cost. f. Prepare Duration versus cost plot. Note that you don't have to compute the floats. S No 1 2 3 5 6 7 8 10 Activity Predecessor A B A A A B Q D [1] E G H C C D E, F G, H Duration and Cost 10 6000 60000 20 1000 20000 15 1000 15000 16 900 14400 15 900 13500 12 1100 13200 10 1200 12000 18 1800 32400 15 500 7500 12 500 6000 Days Cost Per Day Activity Cost Incremental Cost Days Cost Per Day Activity Cost Incremental Cost Days Cost Per Day Activity Cost Incremental Cost Days Cost Per Day Activity Cost Incremental Cost Days Cost Per Day Activity Cost Incremental Cost Days Cost Per Day Activity Cost Incremental Cost Days Cost Per Day Activity Cost Incremental Cost Days Cost Per Day Activity Cost Incremental Cost Days Cost Per Day Activity Cost Incremental Cost Days Cost Per Day Activity Cost Incremental Cost 9 8 20000 40000 180000 320000 120000 140000 19 1500 28500 0 8500 14 1500 21000 6000 15 1200 18000 3600 14 1200 16800 3300 11 1300 14300 1100 9 1500 13500 1500 17 2100 35700 3300 10 1500 15000 7500 10 1500 15000 9000 0 0 0 0 0 0 6000 30000 15000 8 4000 32000 17000

Step by Step Solution

There are 3 Steps involved in it

1 Expert Approved Answer
Step: 1 Unlock blur-text-image
Question Has Been Solved by an Expert!

Get step-by-step solutions from verified subject matter experts

Step: 2 Unlock
Step: 3 Unlock

Students Have Also Explored These Related General Management Questions!