

Question: Q21. Draw the flowchart for the following Read the variable theta(t) and b Calculate the value of Y by using the below formula Print the
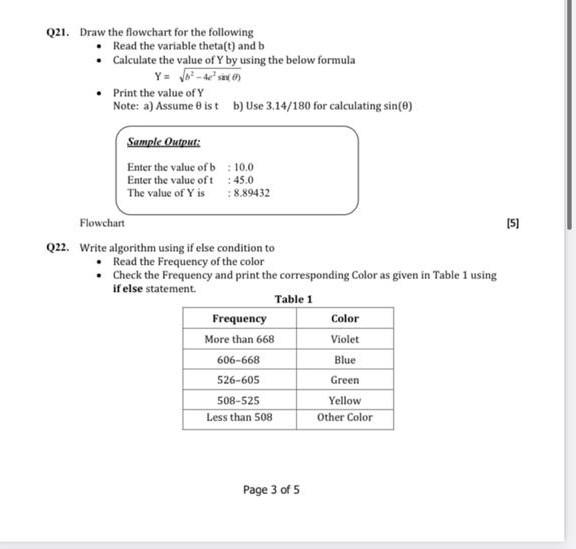
Q21. Draw the flowchart for the following Read the variable theta(t) and b Calculate the value of Y by using the below formula Print the value of Y Note: a) Assume ist b) Use 3.14/180 for calculating sin() Sample Output: Enter the value of b : 10.0 Enter the value oft 45.0 The value of Y is :8.89432 [5] Flowchart Q22. Write algorithm using if else condition to Read the Frequency of the color Check the Frequency and print the corresponding Color as given in Table 1 using if else statement Table 1 Frequency Color More than 668 Violet 606-668 Blue 526-605 Green 508-525 Yellow Less than 508 Other Color Page 3 of 5
Step by Step Solution
There are 3 Steps involved in it
1 Expert Approved Answer
Step: 1 Unlock

Question Has Been Solved by an Expert!
Get step-by-step solutions from verified subject matter experts
Step: 2 Unlock
Step: 3 Unlock