

Question: q23 QUESTION 23 Between Nova and Scotia, which stock do you think investors perceived to have more growth potential? O Nova O Scotia O Both
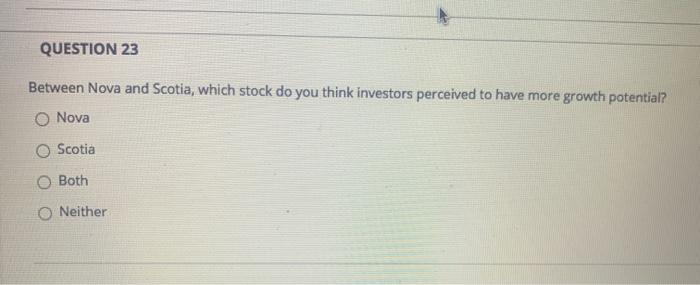
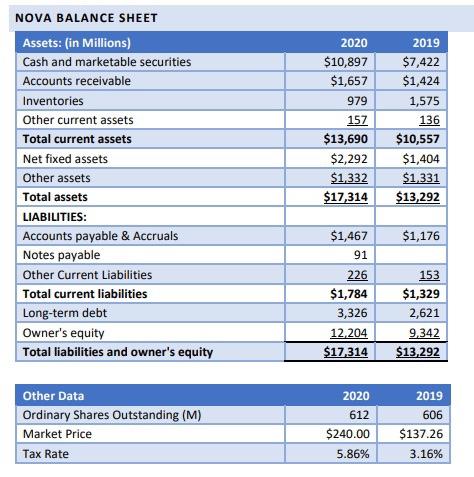
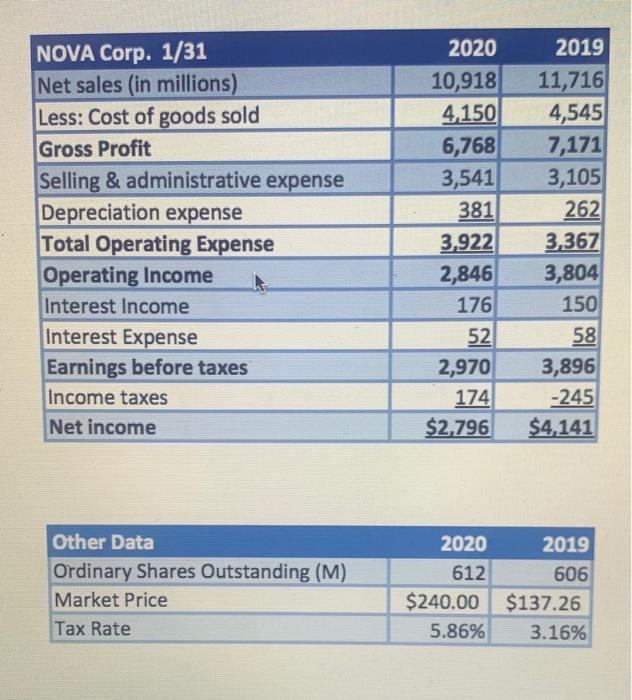
QUESTION 23 Between Nova and Scotia, which stock do you think investors perceived to have more growth potential? O Nova O Scotia O Both Neither NOVA BALANCE SHEET Assets: (in Millions) Cash and marketable securities Accounts receivable Inventories Other current assets Total current assets Net fixed assets Other assets Total assets LIABILITIES: Accounts payable & Accruals Notes payable Other Current Liabilities Total current liabilities Long-term debt Owner's equity Total liabilities and owner's equity 2020 $10,897 $1,657 979 157 $13,690 $2,292 $1,332 $17,314 2019 $7,422 $1,424 1,575 136 $10,557 $1,404 $1,331 $13,292 $1,176 $1,467 91 226 $1,784 3,326 12,204 $17,314 153 $1,329 2,621 9.342 $13,292 2019 Other Data Ordinary Shares Outstanding (M) Market Price Tax Rate 2020 612 $240.00 5.86% 606 $137.26 3.16% NOVA Corp. 1/31 Net sales in millions) Less: Cost of goods sold Gross Profit Selling & administrative expense Depreciation expense Total Operating Expense Operating Income Interest Income Interest Expense Earnings before taxes Income taxes Net income 2020 10,918 4,150 6,768 3,541 381 3,922 2,846 176 52 2,970 174 $2.796 2019 11,716 4,545 7,171 3,105 262 3,367 3,804 150 58 3,896 -245 $4,141 Other Data Ordinary Shares Outstanding (M) Market Price Tax Rate 2020 2019 612 606 $240.00 $137.26 5.86% 3.16% QUESTION 23 Between Nova and Scotia, which stock do you think investors perceived to have more growth potential? O Nova O Scotia O Both Neither NOVA BALANCE SHEET Assets: (in Millions) Cash and marketable securities Accounts receivable Inventories Other current assets Total current assets Net fixed assets Other assets Total assets LIABILITIES: Accounts payable & Accruals Notes payable Other Current Liabilities Total current liabilities Long-term debt Owner's equity Total liabilities and owner's equity 2020 $10,897 $1,657 979 157 $13,690 $2,292 $1,332 $17,314 2019 $7,422 $1,424 1,575 136 $10,557 $1,404 $1,331 $13,292 $1,176 $1,467 91 226 $1,784 3,326 12,204 $17,314 153 $1,329 2,621 9.342 $13,292 2019 Other Data Ordinary Shares Outstanding (M) Market Price Tax Rate 2020 612 $240.00 5.86% 606 $137.26 3.16% NOVA Corp. 1/31 Net sales in millions) Less: Cost of goods sold Gross Profit Selling & administrative expense Depreciation expense Total Operating Expense Operating Income Interest Income Interest Expense Earnings before taxes Income taxes Net income 2020 10,918 4,150 6,768 3,541 381 3,922 2,846 176 52 2,970 174 $2.796 2019 11,716 4,545 7,171 3,105 262 3,367 3,804 150 58 3,896 -245 $4,141 Other Data Ordinary Shares Outstanding (M) Market Price Tax Rate 2020 2019 612 606 $240.00 $137.26 5.86% 3.16%
Step by Step Solution
There are 3 Steps involved in it

Get step-by-step solutions from verified subject matter experts