

Question: Q23 The given data represent the total compensation for 10 randomly selected CEOs and their company's stock performance in 2009. Analysis of this data reveals
Q23
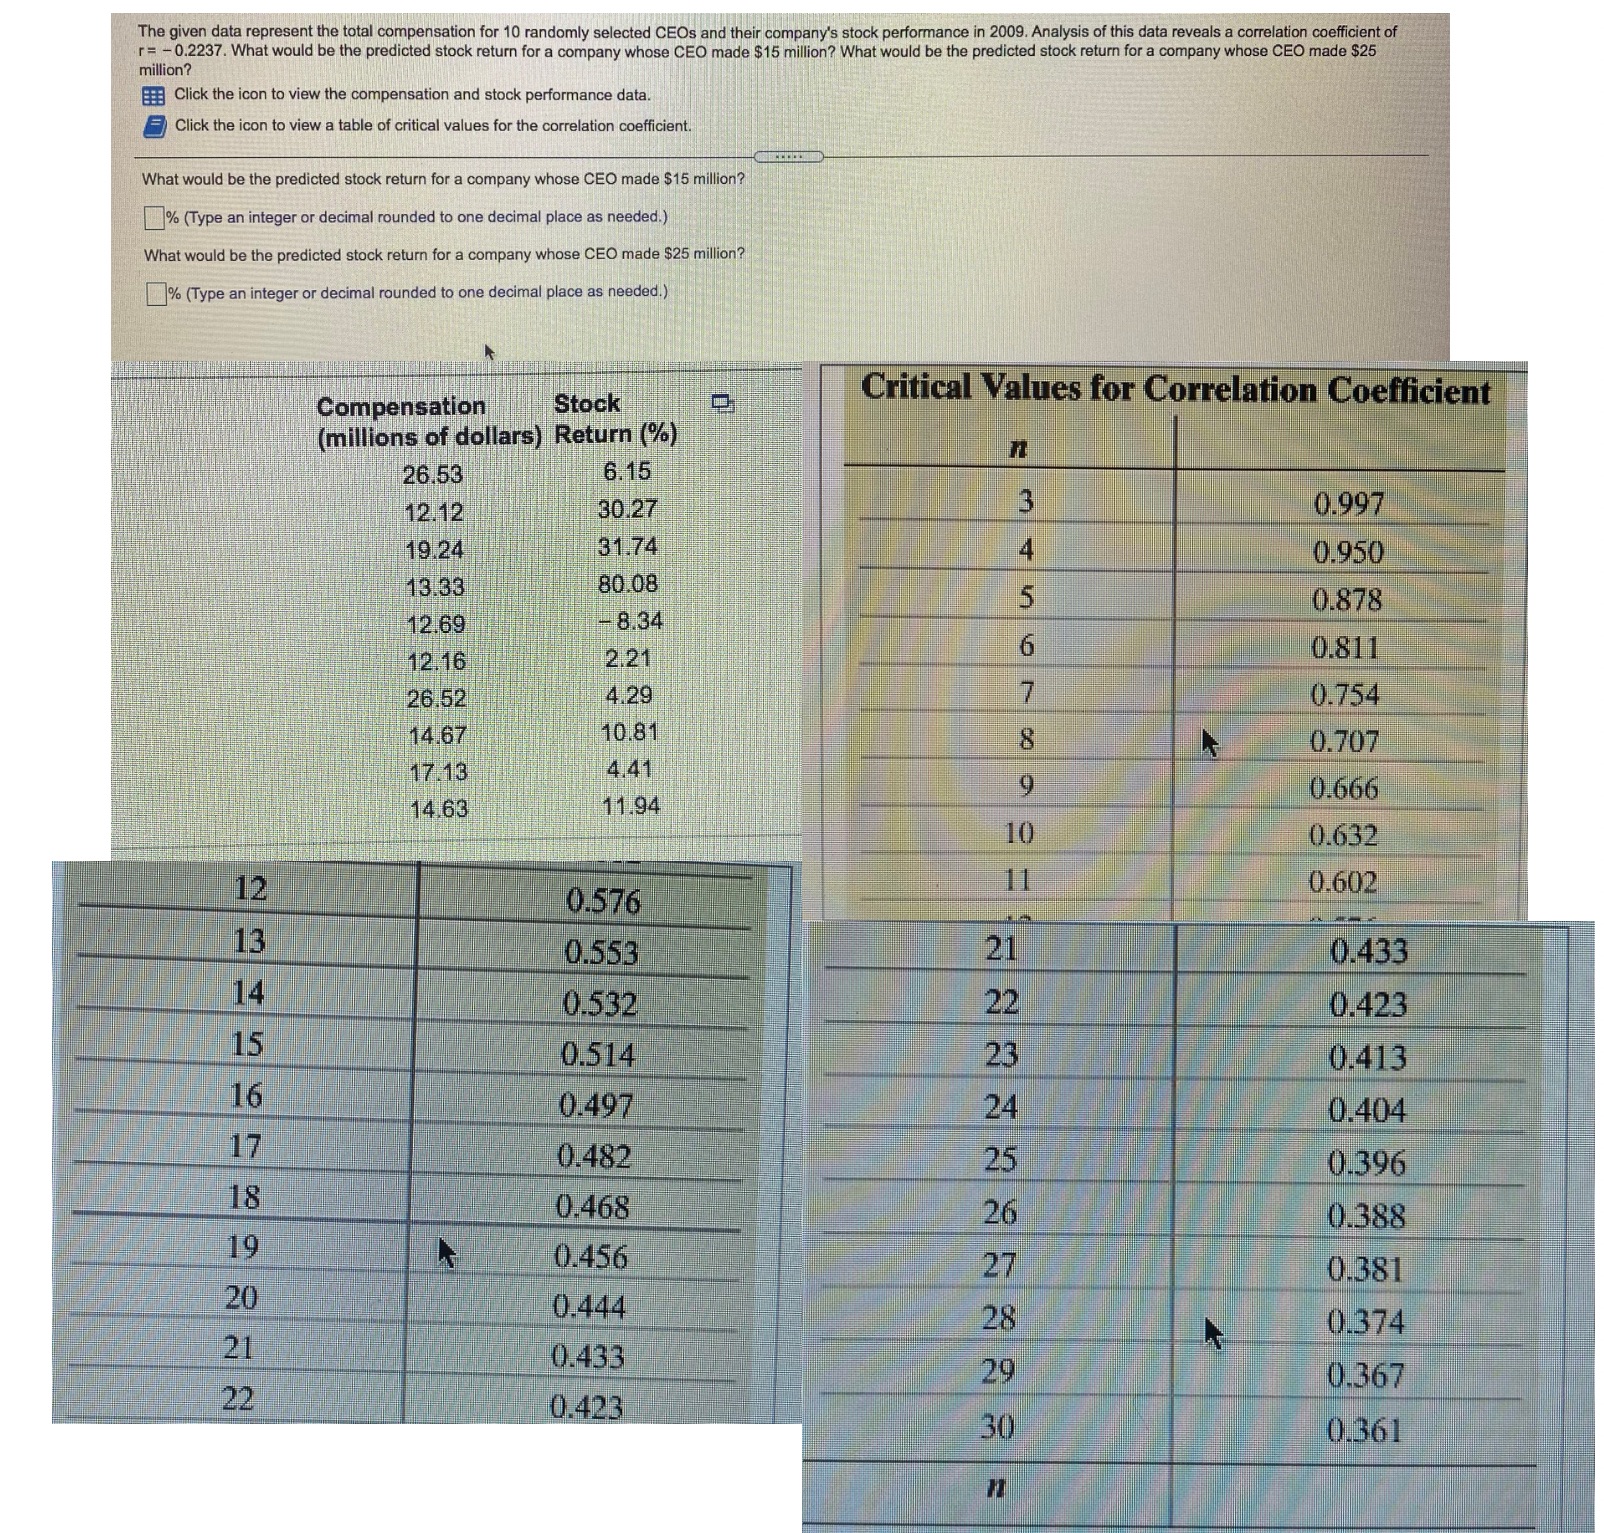
The given data represent the total compensation for 10 randomly selected CEOs and their company's stock performance in 2009. Analysis of this data reveals a correlation coefficient of million? r= -0.2237. What would be the predicted stock return for a company whose CEO made $15 million? What would be the predicted stock return for a company whose CEO made $25 Click the icon to view the compensation and stock performance data. Click the icon to view a table of critical values for the correlation coefficient. What would be the predicted stock return for a company whose CEO made $15 million? % (Type an integer or decimal rounded to one decimal place as needed.) What would be the predicted stock return for a company whose CEO made $25 million? % (Type an integer or decimal rounded to one decimal place as needed.) Compensation Stock Critical Values for Correlation Coefficient (millions of dollars) Return (%) 26.53 6. 15 12.12 30.27 0.997 19.24 31.74 0.950 13.33 80.08 12.69 -8.34 0.878 12.16 2.21 0.811 26.52 4.29 0.754 14.67 10.81 0.707 17.13 1.41 14.63 11.94 0.666 0.632 12 0.576 0.602 13 0.553 0.433 0.532 0.423 0.514 0.413 0.497 0.404 0.482 0.396 0.468 0.388 0.456 0.381 0.444 0.374 0.433 0.423 0.367 0.361
Step by Step Solution
There are 3 Steps involved in it

Get step-by-step solutions from verified subject matter experts