

Question: Q2a. Which rows contain balance sheet information? Which rows contain income statement information? Q2b. Explain the difference between the yellow-highlighted row 14 and row 15.
Q2a. Which rows contain balance sheet information? Which rows contain income statement information?
Q2b. Explain the difference between the yellow-highlighted row 14 and row 15.
Q2c. Explain the difference between rows 25 and 26.
Q2d. Explain the difference between rows 26 and 27.
Q2e. Enter the appropriate formula in B30, B31, and B32, and the correct value in B33.
Q2f. Recommend either accepting or rejecting the project, and explain your reasoning. Cite specific numbers.
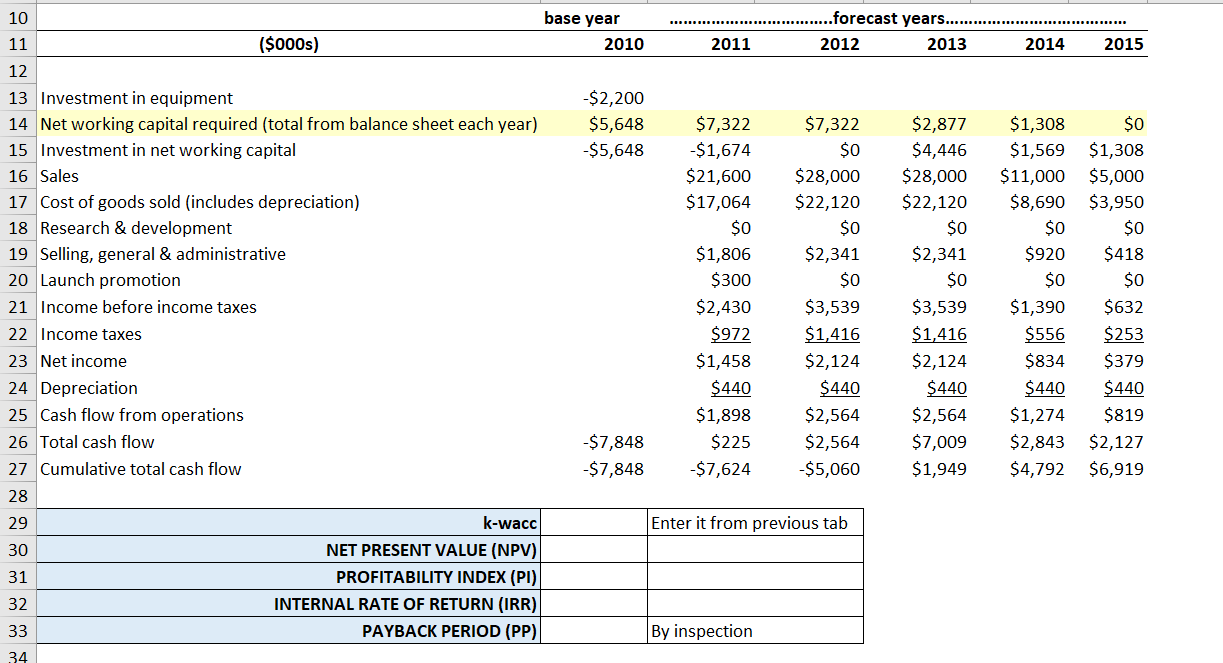
base year ...forecast years...... 2012 2013 2010 2011 2014 2015 -$2,200 $5,648 $5,648 10 11 ($000s) 12 13 Investment in equipment 14 Net working capital required (total from balance sheet each year) 15 Investment in net working capital 16 Sales 17 Cost of goods sold (includes depreciation) 18 Research & development 19 Selling, general & administrative 20 Launch promotion 21 Income before income taxes 22 Income taxes 23 Net income 24 Depreciation 25 Cash flow from operations 26 Total cash flow 27 Cumulative total cash flow 28 29 k-wacc 30 NET PRESENT VALUE (NPV) 31 PROFITABILITY INDEX (PI) 32 INTERNAL RATE OF RETURN (IRR) 33 PAYBACK PERIOD (PP) 34 $7,322 $1,674 $21,600 $17,064 $0 $1,806 $300 $2,430 $972 $1,458 $440 $1,898 $225 -$7,624 $7,322 $0 $28,000 $22,120 $0 $2,341 $0 $3,539 $1,416 $2,124 $440 $2,564 $2,564 $5,060 $2,877 $4,446 $28,000 $22,120 $0 $2,341 $0 $3,539 $1,416 $2,124 $440 $2,564 $7,009 $1,949 $1,308 $0 $1,569 $1,308 $11,000 $5,000 $8,690 $3,950 SO $0 $920 $418 $0 $0 $1,390 $632 $556 $253 $834 $379 $440 $440 $1,274 $819 $2,843 $2,127 $4,792 $6,919 $7,848 $ 7,848 Enter it from previous tab By inspection base year ...forecast years...... 2012 2013 2010 2011 2014 2015 -$2,200 $5,648 $5,648 10 11 ($000s) 12 13 Investment in equipment 14 Net working capital required (total from balance sheet each year) 15 Investment in net working capital 16 Sales 17 Cost of goods sold (includes depreciation) 18 Research & development 19 Selling, general & administrative 20 Launch promotion 21 Income before income taxes 22 Income taxes 23 Net income 24 Depreciation 25 Cash flow from operations 26 Total cash flow 27 Cumulative total cash flow 28 29 k-wacc 30 NET PRESENT VALUE (NPV) 31 PROFITABILITY INDEX (PI) 32 INTERNAL RATE OF RETURN (IRR) 33 PAYBACK PERIOD (PP) 34 $7,322 $1,674 $21,600 $17,064 $0 $1,806 $300 $2,430 $972 $1,458 $440 $1,898 $225 -$7,624 $7,322 $0 $28,000 $22,120 $0 $2,341 $0 $3,539 $1,416 $2,124 $440 $2,564 $2,564 $5,060 $2,877 $4,446 $28,000 $22,120 $0 $2,341 $0 $3,539 $1,416 $2,124 $440 $2,564 $7,009 $1,949 $1,308 $0 $1,569 $1,308 $11,000 $5,000 $8,690 $3,950 SO $0 $920 $418 $0 $0 $1,390 $632 $556 $253 $834 $379 $440 $440 $1,274 $819 $2,843 $2,127 $4,792 $6,919 $7,848 $ 7,848 Enter it from previous tab By inspection
Step by Step Solution
There are 3 Steps involved in it

Get step-by-step solutions from verified subject matter experts