

Question: Q2...its mamcro exain with graph Exercises Question 1 (Practice Quiz) You need two large, clear graphs (one for each question) for this quiz, and short
Q2...its mamcro exain with graph
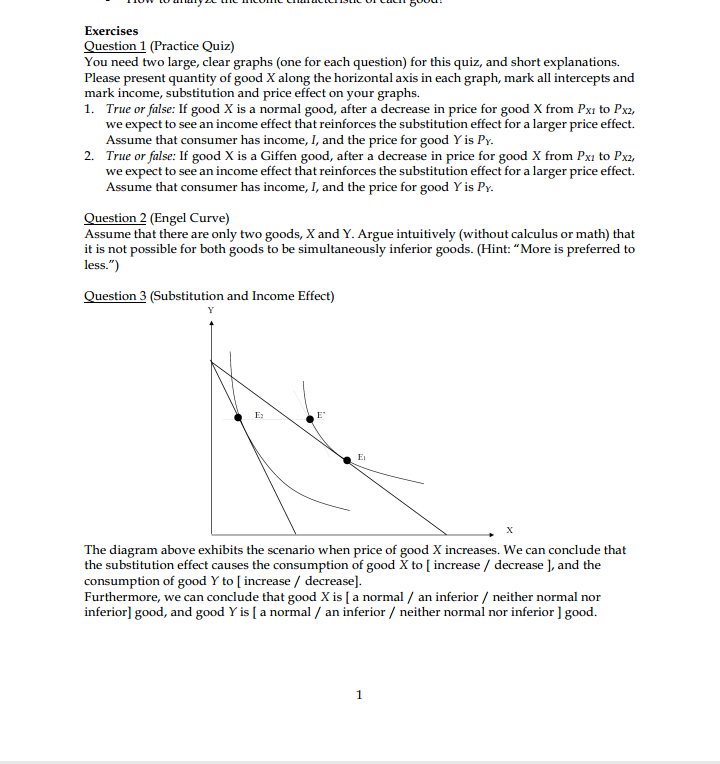
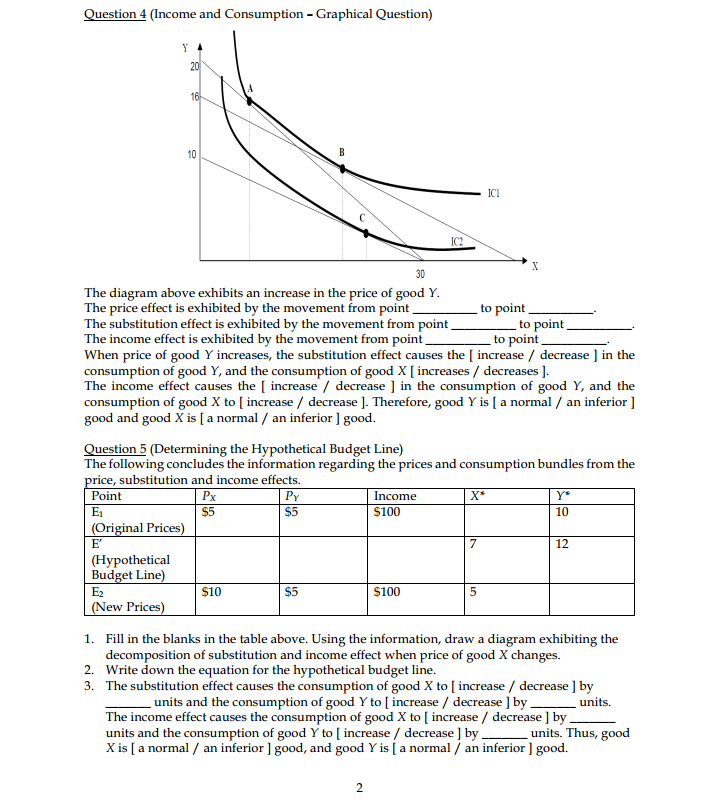
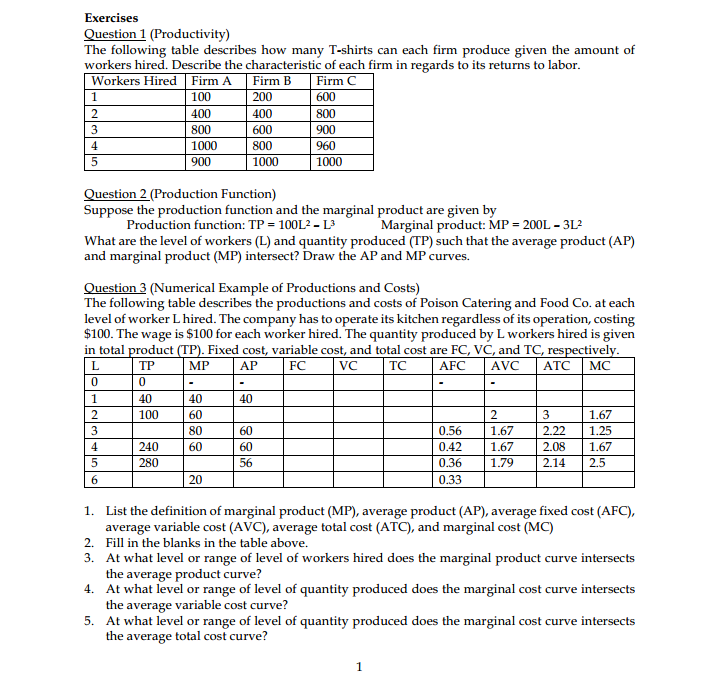
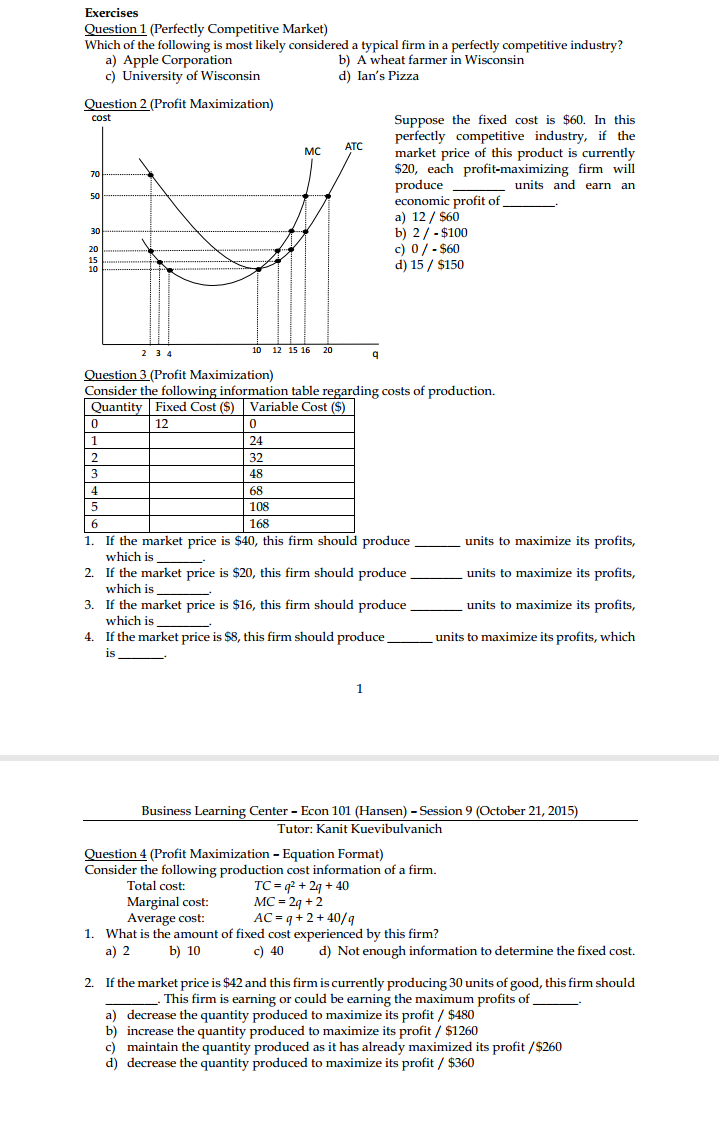
Exercises Question 1 (Practice Quiz) You need two large, clear graphs (one for each question) for this quiz, and short explanations. Please present quantity of good X along the horizontal axis in each graph, mark all intercepts and mark income, substitution and price effect on your graphs. 1. True or false: If good X is a normal good, after a decrease in price for good X from Px1 to Pxz, we expect to see an income effect that reinforces the substitution effect for a larger price effect. Assume that consumer has income, I, and the price for good Y is Py. True or false: If good X is a Giffen good, after a decrease in price for good X from Pxi to Pxz, we expect to see an income effect that reinforces the substitution effect for a larger price effect. Assume that consumer has income, I, and the price for good Y is Py. Question 2 (Engel Curve) Assume that there are only two goods, X and Y. Argue intuitively (without calculus or math) that it is not possible for both goods to be simultaneously inferior goods. (Hint: "More is preferred to less.") Question 3 (Substitution and Income Effect) X The diagram above exhibits the scenario when price of good X increases. We can conclude that the substitution effect causes the consumption of good X to [ increase / decrease ], and the consumption of good Y to [ increase / decrease]. Furthermore, we can conclude that good X is [ a normal / an inferior / neither normal nor inferior] good, and good Y is [ a normal / an inferior / neither normal nor inferior ] good.Question 4 (Income and Consumption - Graphical Question) 20 16- 10 - ICI C IC 30 The diagram above exhibits an increase in the price of good Y. The price effect is exhibited by the movement from point to point_ The substitution effect is exhibited by the movement from point to point The income effect is exhibited by the movement from point to point. When price of good Y increases, the substitution effect causes the [ increase / decrease ] in the consumption of good Y, and the consumption of good X [ increases / decreases ]. The income effect causes the [ increase / decrease ] in the consumption of good Y, and the consumption of good X to [ increase / decrease ]. Therefore, good Y is [ a normal / an inferior ] good and good X is [ a normal / an inferior ] good Question 5 (Determining the Hypothetical Budget Line) The following concludes the information regarding the prices and consumption bundles from the price, substitution and income effects. Point Px PY Income Y* E1 $5 $5 $100 10 (Original Prices) E' 7 12 (Hypothetical Budget Line Ez $10 $5 $100 5 (New Prices) 1. Fill in the blanks in the table above. Using the information, draw a diagram exhibiting the decomposition of substitution and income effect when price of good X changes. 2. Write down the equation for the hypothetical budget line. 3. The substitution effect causes the consumption of good X to [ increase / decrease ] by units and the consumption of good Y to [ increase / decrease ] by . _ units. The income effect causes the consumption of good X to [ increase / decrease ] by units and the consumption of good Y to [ increase / decrease ] by _ _ units. Thus, good X is [ a normal / an inferior ] good, and good Y is [ a normal / an inferior ] good.Exercises Question 1 (Productivity) The following table describes how many T-shirts can each firm produce given the amount of workers hired. Describe the characteristic of each firm in regards to its returns to labor. Workers Hired |Firm A Firm B Firm C 100 200 600 2 400 400 800 3 800 600 900 4 1000 800 960 5 900 1000 1000 Question 2 (Production Function) Suppose the production function and the marginal product are given by Production function: TP = 10013 - L3 Marginal product: MP = 200L - 312 What are the level of workers (L) and quantity produced (TP) such that the average product (AP) and marginal product (MP) intersect? Draw the AP and MP curves. Question 3 (Numerical Example of Productions and Costs) The following table describes the productions and costs of Poison Catering and Food Co. at each level of worker L hired. The company has to operate its kitchen regardless of its operation, costing $100. The wage is $100 for each worker hired. The quantity produced by L workers hired is given in total product (TP). Fixed cost, variable cost, and total cost are FC, VC, and TC, respectively. L TF MP AP FC VC TC AFC AVC ATC MC 0 0 1 40 40 40 2 100 60 2 3 1.67 3 80 60 0.56 1.67 2.22 1.25 4 240 60 60 0.42 1.67 2.08 1.67 5 280 56 0.36 1.79 2.14 2.5 20 0.33 1. List the definition of marginal product (MP), average product (AP), average fixed cost (AFC), average variable cost (AVC), average total cost (ATC), and marginal cost (MC) 2. Fill in the blanks in the table above 3. At what level or range of level of workers hired does the marginal product curve intersects the average product curve? 4. At what level or range of level of quantity produced does the marginal cost curve intersects the average variable cost curve? 5. At what level or range of level of quantity produced does the marginal cost curve intersects the average total cost curve?Exercises Question 1 (Perfectly Competitive Market] Which of the following is most likely considered a typical firm in a perfectly oompetitive industry? a} Apple Corporation h} A wheat farmer in Wisconsin c] University of Wisconsin d} Ian's Pizza Suppose the xed cost is $60. In this perfectly competitive industry, it the market price of this product is currently $20, each prot-maximizing rm will produce units and earn an h]. 23-15100 c} 0f-$60 d}15f$1so Emestion 3 (Prot Mardmizalim't] Consider the following information table regarding costs of production. 1. If the market price is $40, this rm should produce units to maximize its prots, which Is 2. If the market price is $20 this rm should produce units to maximize its prots, which Is 3. If the market price is $16 this rm should produce units to maximize its prots, which Is 4. If the market price is $3 this rm should produce units to maximize its profits, which is 1 Business Learning Center - Econ 101 (Hansen) - Session 9 (October 2],. 2015} Tutor: Kanit Kuevihulvanich Question 4 (Prot Maidmizatim't - Equation Format] Consider the Following production cost information of a rm. Total cost: Tf=q2+2q+4 Marginal cost: MC = 2g + 2 Average cost: AC = q + 2 + 40ft; 1. What is the amount of fixed cost experienced by this rm? a} 2 h] 10 c} 40 d} Not enough information to determine the xed cost. 2. If the market price is$42and this rmis currently producingI-II units of good this rm should .This firm is earning or could be earning the maximum prots of a} decrease the quantity produced to maximize its prot I $430 13} increase the quantity produced to maximize its prot 3" $1260 c] maintain the quantity produced as it has already maximized its prot f$260 d} decrease the quantity produced to maximize its prot f $360
Step by Step Solution
There are 3 Steps involved in it

Get step-by-step solutions from verified subject matter experts