

Question: Q2:Write MATLAB commands that show the below figure (SFS Plotting 100 90 Sort x? 80 70 60 Y-axis 50 40 30 20 10 0 -100
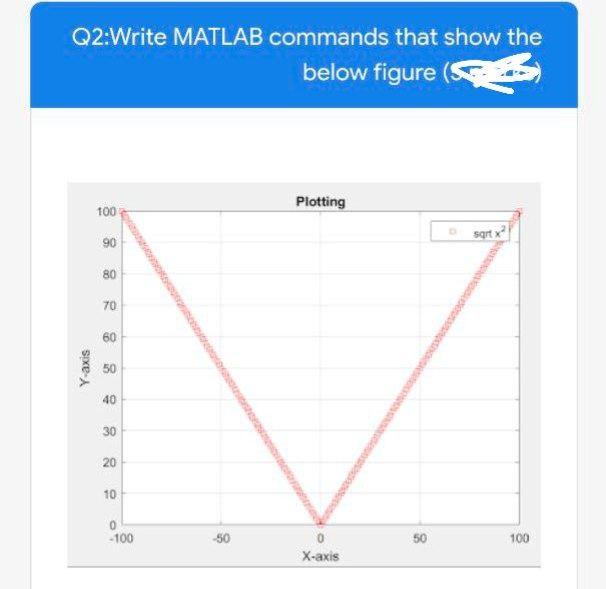
Q2:Write MATLAB commands that show the below figure (SFS Plotting 100 90 Sort x? 80 70 60 Y-axis 50 40 30 20 10 0 -100 -50 100 X-axis
Step by Step Solution
There are 3 Steps involved in it
1 Expert Approved Answer
Step: 1 Unlock

Question Has Been Solved by an Expert!
Get step-by-step solutions from verified subject matter experts
Step: 2 Unlock
Step: 3 Unlock