

Question: Q3) A surface at 2000K has the emissive characteristics shown in Figure Q3. (12) a) Plot the spectral distribution of Emissive power for this
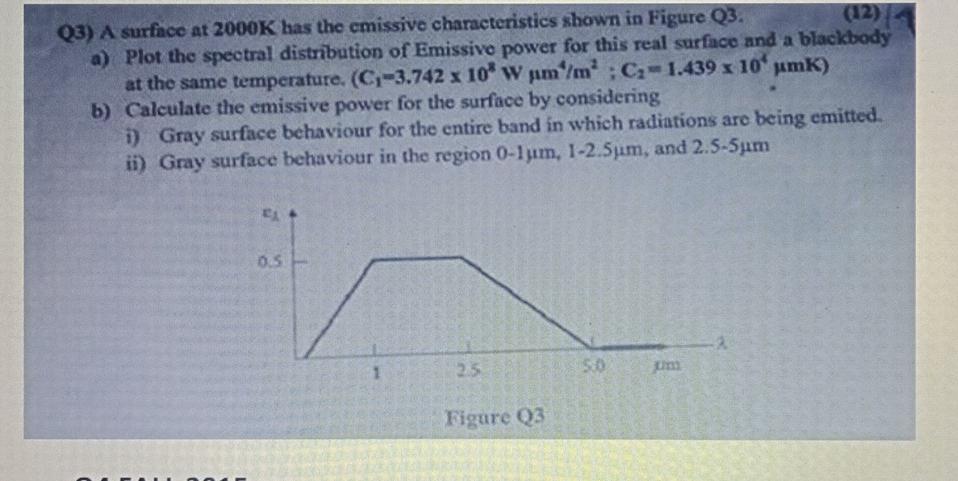
Q3) A surface at 2000K has the emissive characteristics shown in Figure Q3. (12) a) Plot the spectral distribution of Emissive power for this real surface and a blackbody at the same temperature. (C1-3.742 x 10 W m/m; C-1.439 x 10 m) b) Calculate the emissive power for the surface by considering i) Gray surface behaviour for the entire band in which radiations are being emitted. ii) Gray surface behaviour in the region 0-1m, 1-2.5m, and 2.5-5m EA 0.5 2.5 Figure Q3 5:0 um
Step by Step Solution
There are 3 Steps involved in it
1 Expert Approved Answer
Step: 1 Unlock

Question Has Been Solved by an Expert!
Get step-by-step solutions from verified subject matter experts
Step: 2 Unlock
Step: 3 Unlock