

Question: Q3 and Q4 1. Record the beverage samples you will be testing (these microcentrifuge tubes are labeled B, with # being some number). B32 and
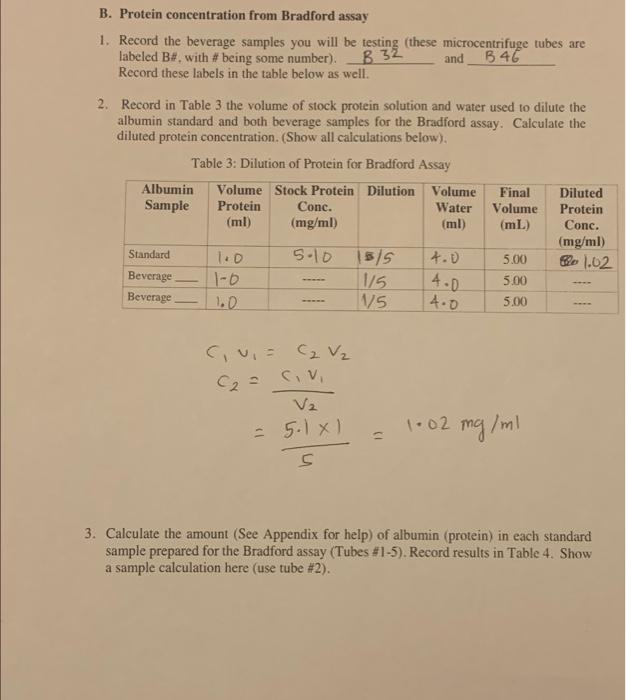
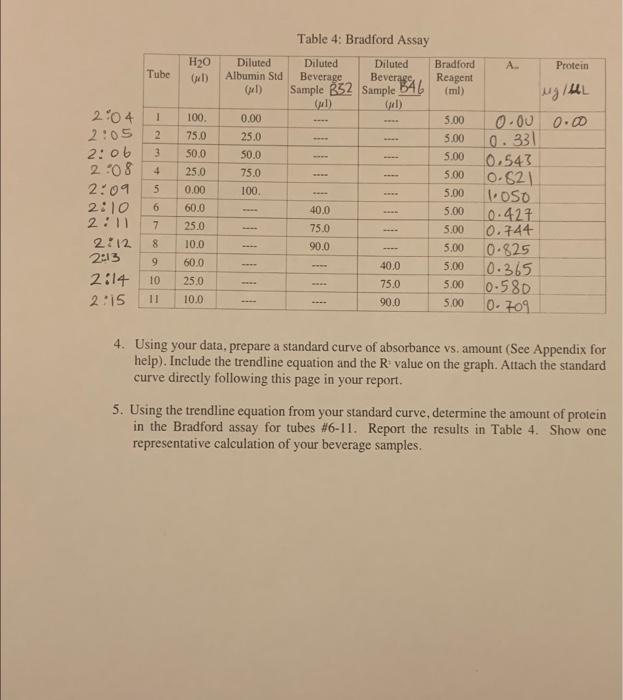
1. Record the beverage samples you will be testing (these microcentrifuge tubes are labeled B, with \# being some number). B32 and B46 Record these labels in the table below as well. 2. Record in Table 3 the volume of stock protein solution and water used to dilute the albumin standard and both beverage samples for the Bradford assay. Calculate the diluted protein concentration. (Show all calculations below). Table 3: Dilution of Protein for Bradford Assay C1v1C2=C2v2=v2C1v1=55.11=1.02mg/ml 3. Calculate the amount (See Appendix for help) of albumin (protein) in each standard sample prepared for the Bradford assay (Tubes #15 ). Record results in Table 4. Show a sample calculation here (use tube \#2). Table 4: Bradford Assay 4. Using your data, prepare a standard curve of absorbance vs, amount (See Appendix for help). Include the trendline equation and the R value on the graph. Attach the standard curve directly following this page in your report. 5. Using the trendline equation from your standard curve, determine the amount of protein in the Bradford assay for tubes \#6-11. Report the results in Table 4 . Show one representative calculation of your beverage samples. 1. Record the beverage samples you will be testing (these microcentrifuge tubes are labeled B, with \# being some number). B32 and B46 Record these labels in the table below as well. 2. Record in Table 3 the volume of stock protein solution and water used to dilute the albumin standard and both beverage samples for the Bradford assay. Calculate the diluted protein concentration. (Show all calculations below). Table 3: Dilution of Protein for Bradford Assay C1v1C2=C2v2=v2C1v1=55.11=1.02mg/ml 3. Calculate the amount (See Appendix for help) of albumin (protein) in each standard sample prepared for the Bradford assay (Tubes #15 ). Record results in Table 4. Show a sample calculation here (use tube \#2). Table 4: Bradford Assay 4. Using your data, prepare a standard curve of absorbance vs, amount (See Appendix for help). Include the trendline equation and the R value on the graph. Attach the standard curve directly following this page in your report. 5. Using the trendline equation from your standard curve, determine the amount of protein in the Bradford assay for tubes \#6-11. Report the results in Table 4 . Show one representative calculation of your beverage samples
Step by Step Solution
There are 3 Steps involved in it

Get step-by-step solutions from verified subject matter experts