

Question: Q3: Below two figures are the same single-core microprocessor design in 90nm (left) and 65nm (right), respectively. The left design has a total area of
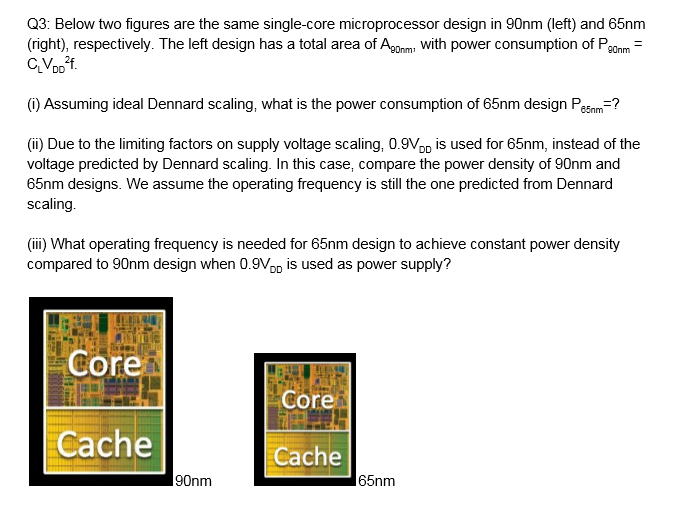
Q3: Below two figures are the same single-core microprocessor design in 90nm (left) and 65nm (right), respectively. The left design has a total area of Agorm, with power consumption of Pgonm = CLV. 24. ) Assuming ideal Dennard scaling, what is the power consumption of 65nm design Pesom=? (ii) Due to the limiting factors on supply voltage scaling, 0.9Vpp is used for 65nm, instead of the voltage predicted by Dennard scaling. In this case, compare the power density of 90nm and 65nm designs. We assume the operating frequency is still the one predicted from Dennard scaling. (iii) What operating frequency is needed for 65nm design to achieve constant power density compared to 90nm design when 0.9Vpp is used as power supply? Core LU Core Cache Cache 90nm 65nm Q3: Below two figures are the same single-core microprocessor design in 90nm (left) and 65nm (right), respectively. The left design has a total area of Agorm, with power consumption of Pgonm = CLV. 24. ) Assuming ideal Dennard scaling, what is the power consumption of 65nm design Pesom=? (ii) Due to the limiting factors on supply voltage scaling, 0.9Vpp is used for 65nm, instead of the voltage predicted by Dennard scaling. In this case, compare the power density of 90nm and 65nm designs. We assume the operating frequency is still the one predicted from Dennard scaling. (iii) What operating frequency is needed for 65nm design to achieve constant power density compared to 90nm design when 0.9Vpp is used as power supply? Core LU Core Cache Cache 90nm 65nm
Step by Step Solution
There are 3 Steps involved in it

Get step-by-step solutions from verified subject matter experts