

Question: Q3. Develop a table somewhat similar to exhibit 1.3 (on page 9). List three new examples under each category i.e. Pure Goods, Core Goods, Core
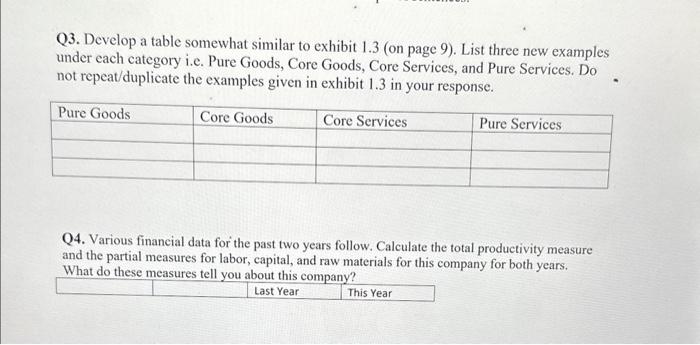
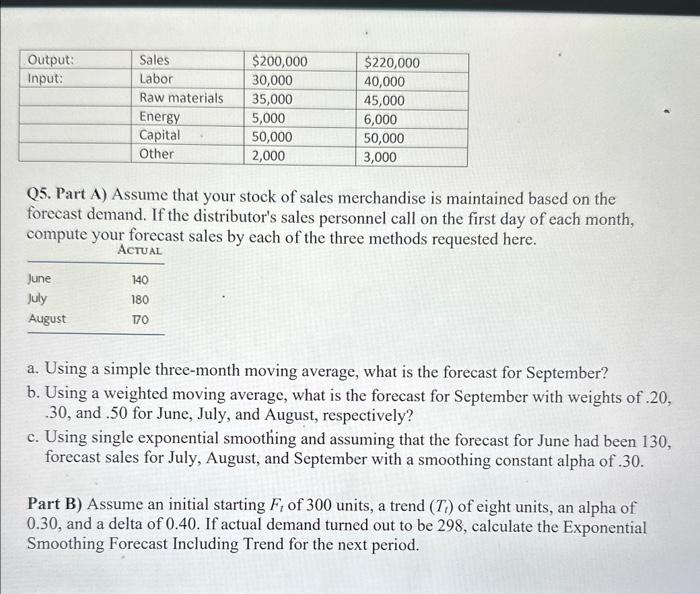
Q3. Develop a table somewhat similar to exhibit 1.3 (on page 9). List three new examples under each category i.e. Pure Goods, Core Goods, Core Services, and Pure Services. Do not repeat/duplicate the examples given in exhibit 1.3 in your response. Q4. Various financial data for the past two years follow. Calculate the total productivity measure and the partial measures for labor, capital, and raw materials for this company for both years. What do these measuree toll wou ahow at:- Q5. Part A) Assume that your stock of sales merchandise is maintained based on the forecast demand. If the distributor's sales personnel call on the first day of each month, compute your forecast sales by each of the three methods requested here. a. Using a simple three-month moving average, what is the forecast for September? b. Using a weighted moving average, what is the forecast for September with weights of .20, .30, and .50 for June, July, and August, respectively? c. Using single exponential smoothing and assuming that the forecast for June had been 130 , forecast sales for July, August, and September with a smoothing constant alpha of .30. Part B) Assume an initial starting Ft of 300 units, a trend (Tt) of eight units, an alpha of 0.30, and a delta of 0.40. If actual demand turned out to be 298 , calculate the Exponential Smoothing Forecast Including Trend for the next period
Step by Step Solution
There are 3 Steps involved in it

Get step-by-step solutions from verified subject matter experts