

Question: Q3: Figure 1 shows a cooling curve for the conversion of gaseous water to ice. Answer the following question regarding the figure given below or
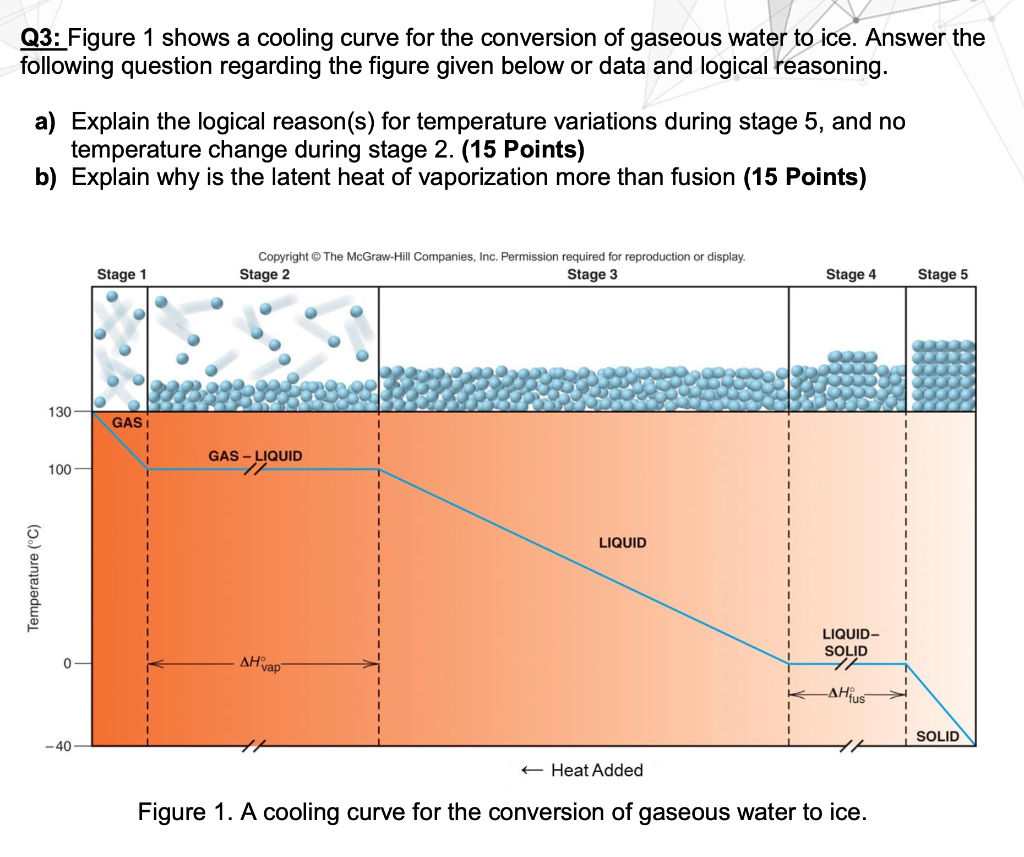
Q3: Figure 1 shows a cooling curve for the conversion of gaseous water to ice. Answer the following question regarding the figure given below or data and logical reasoning. a) Explain the logical reason(s) for temperature variations during stage 5, and no temperature change during stage 2. (15 Points) b) Explain why is the latent heat of vaporization more than fusion (15 Points) Stage 1 Copyright The McGraw-Hill Companies, Inc. Permission required for reproduction or display. Stage 2 Stage 3 Stage 4 Stage 5 130 - GASI GAS - LIQUID 100 LIQUID Temperature (C) LIQUID- SOLID AHvap -AHius SOLID -40 + Heat Added Figure 1. A cooling curve for the conversion of gaseous water to ice
Step by Step Solution
There are 3 Steps involved in it

Get step-by-step solutions from verified subject matter experts