

Question: Q3. From the following Table and Chart explain how the Dubai Financial Market General Index (DFMGI) movement during the period May 29, 2021- Nov 24,
Q3. From the following Table and Chart explain how the Dubai Financial Market General Index (DFMGI) movement during the period May 29, 2021- Nov 24, 2021? And identify any risks faced by investors investing in stocks in UAE financial market? (CLO3) (5 Marks, 75-100 words).
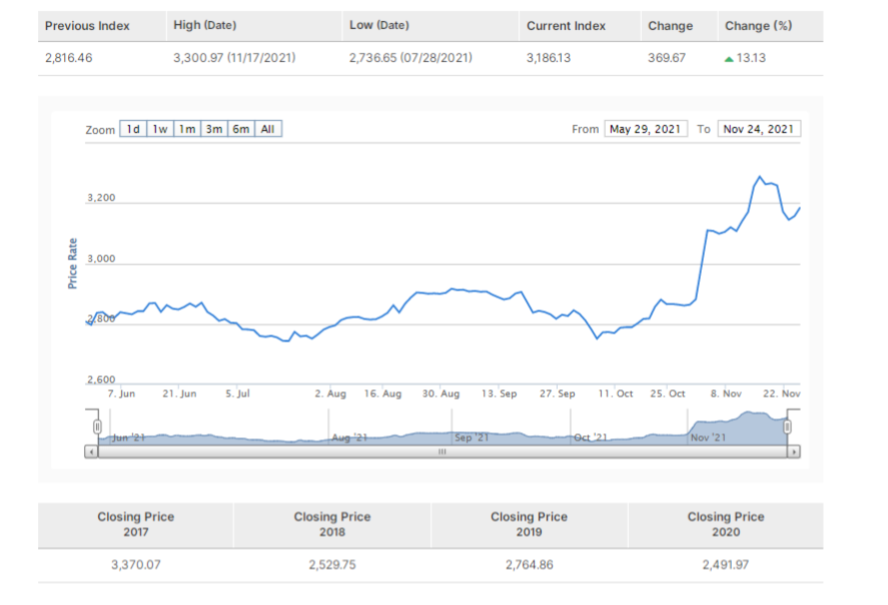
Previous Index High (Date) Current Index Change Change (%) Low (Date) 2,736.65 (07/28/2021) 2,816.46 3,300.97 (11/17/2021) 3,186.13 369.67 13.13 Zoom 1d lw 1m 3m 6m All From May 29, 2021 TO Nov 24, 2021 3,200 Price Rate 3,000 2.600 7. Jun 21. Jun 5. Jul 2. Aug 16. Aug 30. Aug 13. Sep 27. sep 11. Oct 25. Oct 8. Nov 22. Nov June Sep 2T Oct Nov 21 Closing Price 2017 Closing Price 2018 Closing Price 2019 Closing Price 2020 3,370.07 2,529.75 2,764.86 2,491.97
Step by Step Solution
There are 3 Steps involved in it

Get step-by-step solutions from verified subject matter experts