

Question: Q3 Plot 1.jpeg 2 Points For each of the provided plots, identify what the individual observations (what are they?) in the shaded region of the
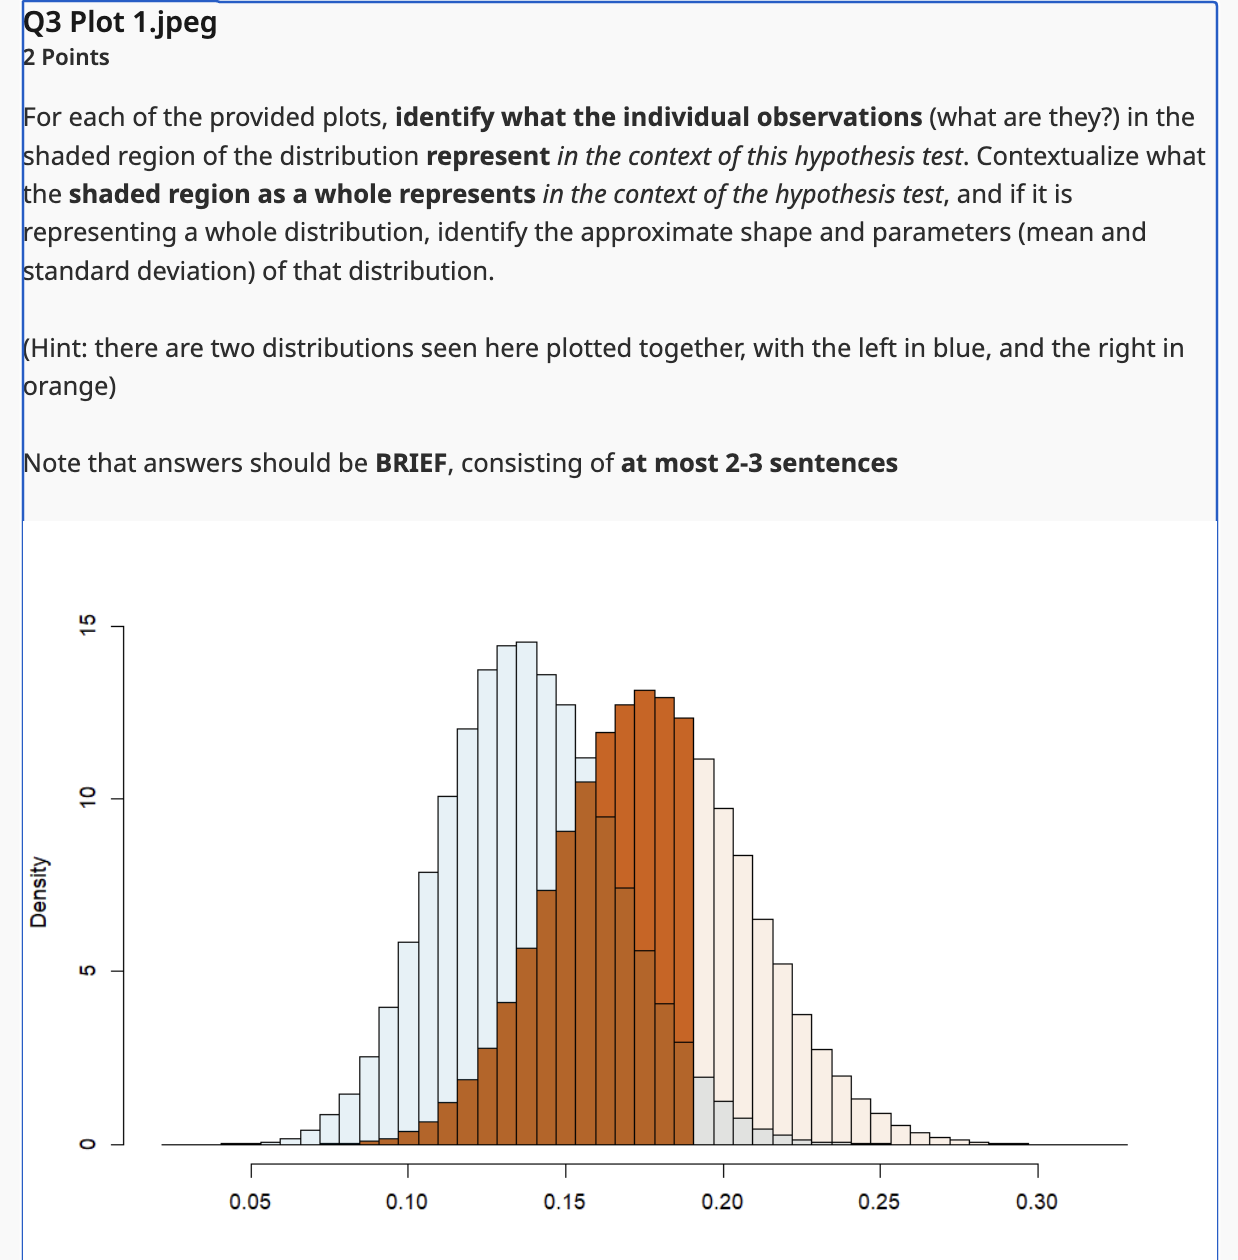
Q3 Plot 1.jpeg 2 Points For each of the provided plots, identify what the individual observations (what are they?) in the shaded region of the distribution represent in the context of this hypothesis test. Contextualize what the shaded region as a whole represents in the context of the hypothesis test, and if it is representing a whole distribution, identify the approximate shape and parameters (mean and standard deviation) of that distribution. (Hint: there are two distributions seen here plotted together, with the left in blue, and the right in orange) Note that answers should be BRIEF, consisting of at most 2-3 sentences Density LO 0.05 0.10 0.15 0.20 0.25 0.30
Step by Step Solution
There are 3 Steps involved in it

Get step-by-step solutions from verified subject matter experts