

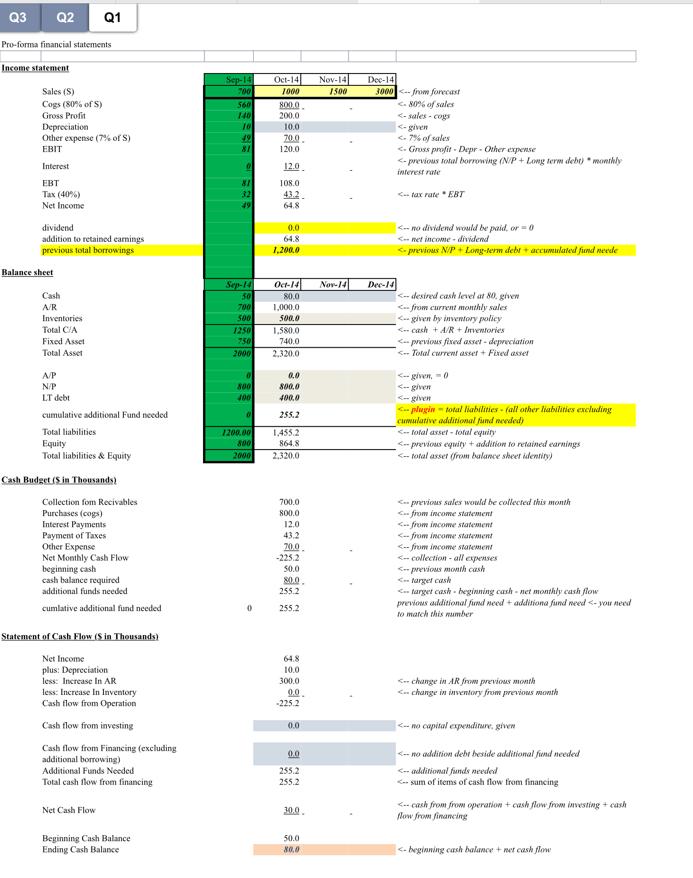
Q3 Q2 Pro-forma financial statements Income statement Sales (S) Cogs (80% of 5) Gross Profit Depreciation...
Fantastic news! We've Found the answer you've been seeking!
Question:
Transcribed Image Text:
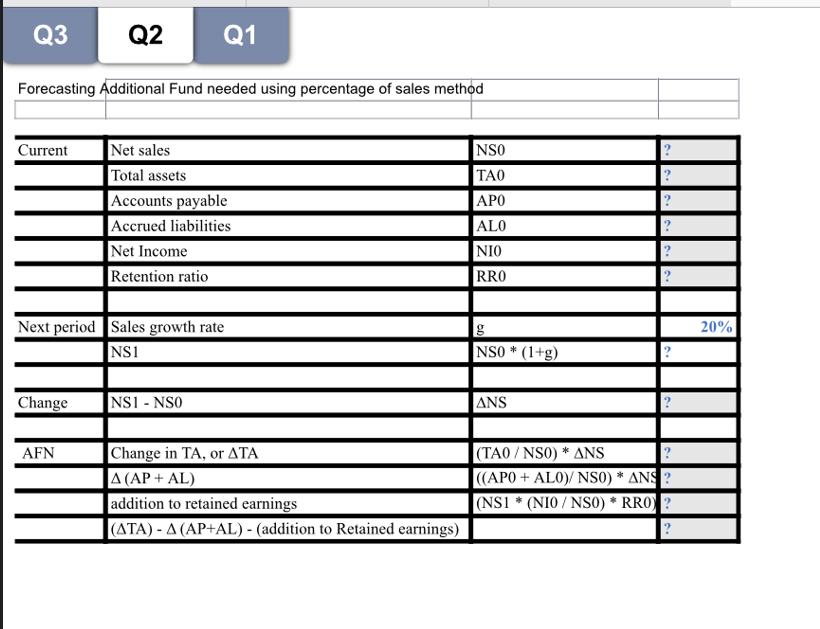
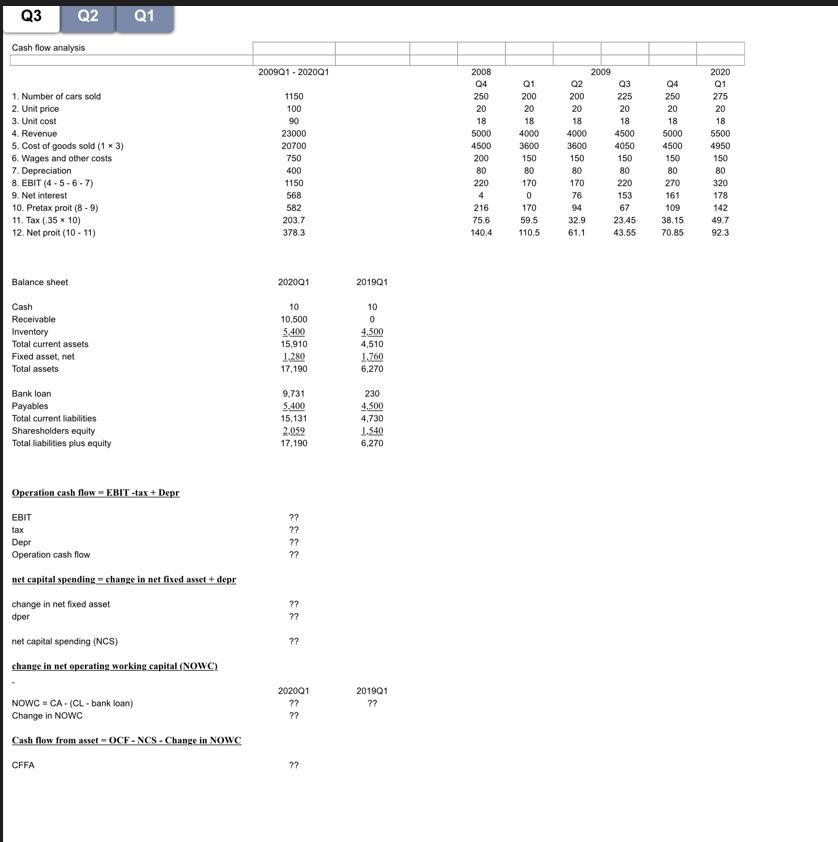
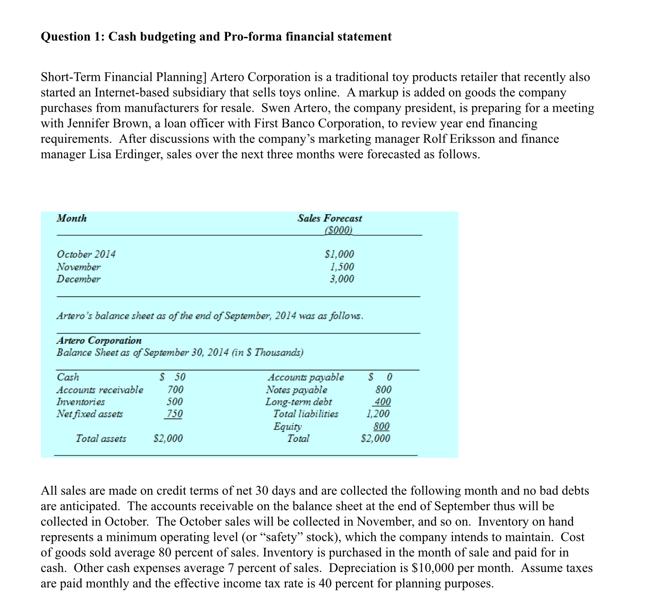
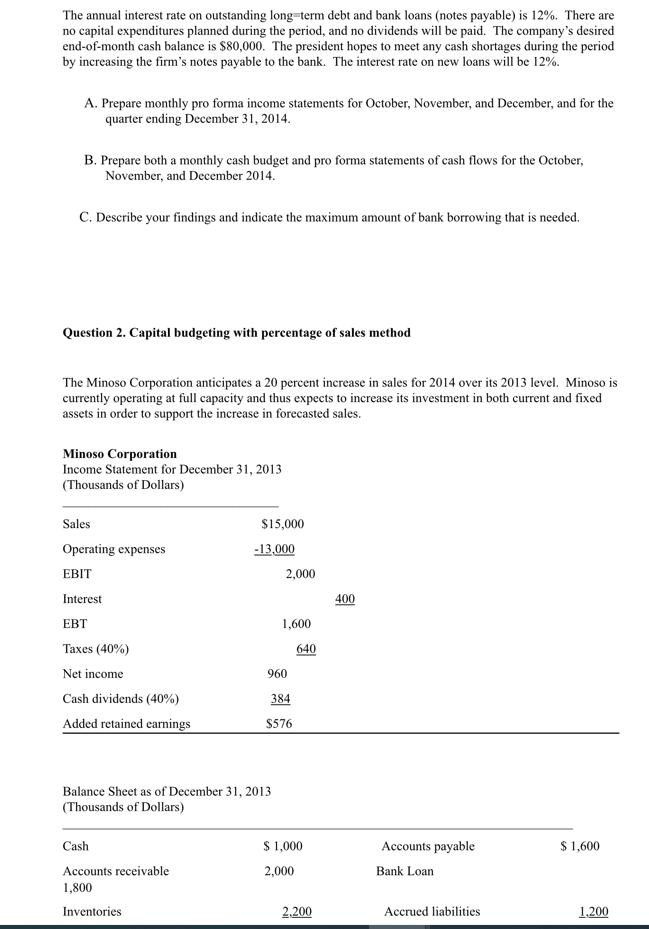
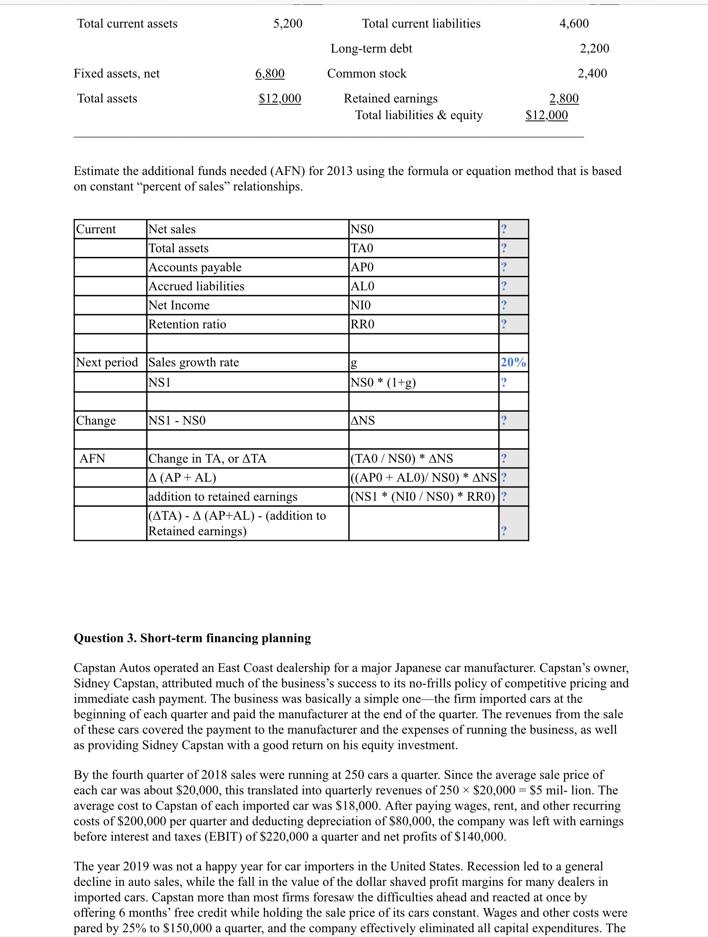
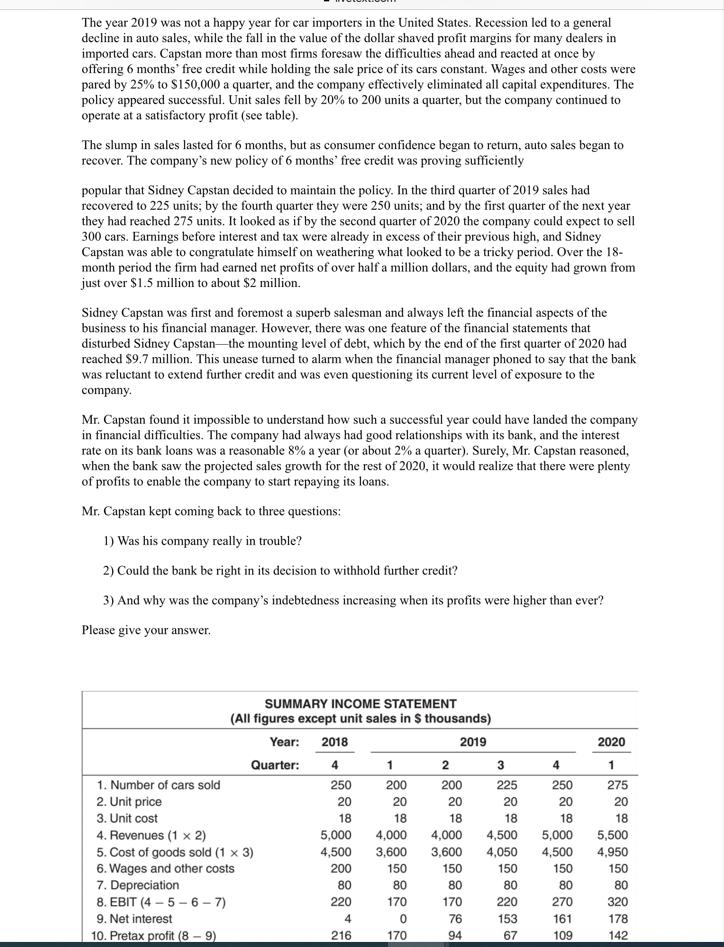
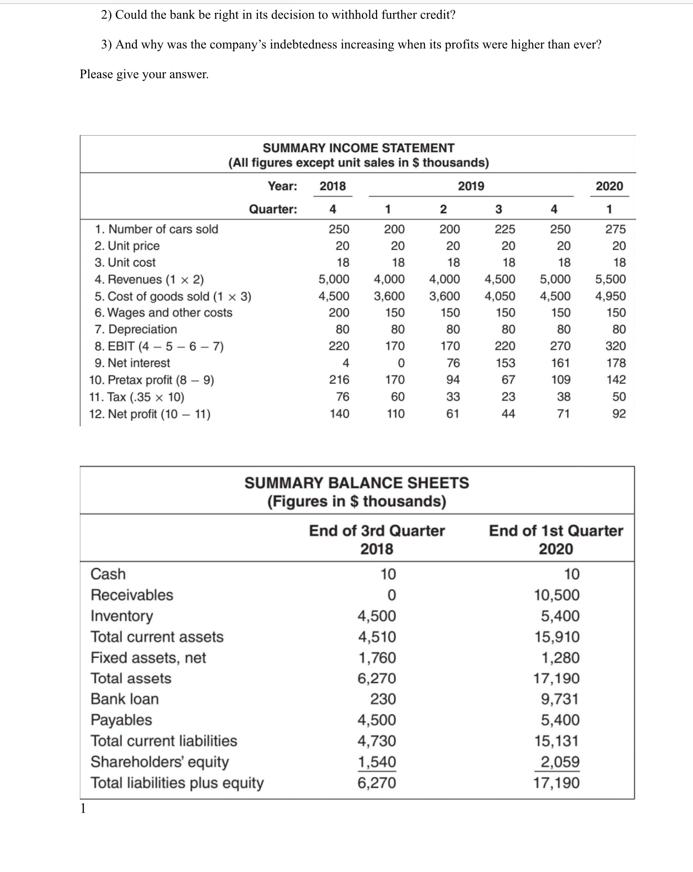
Q3 Q2 Pro-forma financial statements Income statement Sales (S) Cogs (80% of 5) Gross Profit Depreciation Other expense (7% of S) EBIT Interest EBT Tax (40%) Net Income dividend addition to retained earnings previous total borrowings Balance sheet Q1 Cash A/R Inventories Total C/A Fixed Asset Total Asset A/P N/P LT debt cumulative additional Fund needed Total liabilities Equity Total liabilities & Equity Cash Budget (S in Thousands) Collection fom Recivables Purchases (cogs) Interest Payments Payment of Taxes Other Expense Net Monthly Cash Flow beginning cash cash balance required additional funds needed cumlative additional fund needed Statement of Cash Flow (S in Thousands) Net Income plus: Depreciation less: Increase In AR less: Increase In Inventory Cash flow from Operation Cash flow from investing Cash flow from Financing (excluding additional borrowing) Additional Funds Needed Total cash flow from financing Net Cash Flow Beginning Cash Balance - Ending Cash Balance Sep-14 Oct-14 700 1000 560 140 10 49 81 138 Sep-14 50 700 500 1250 750 2000 0 800 400 0 1200.00 800 2000 0 800.0 200.0 10.0 70.0 120.0 12.0 108.0 43.2 64.8 0.0 64.8 1,200.0 Oct-14 80.0 1,000.0 500.0 1,580.0 740.0 2,320.0 0.0 800.0 400.0 255.2 1,455.2 864.8 2,320.0 700.0 800.0 12.0 43.2 70.0 -225.2 50.0 80.0 255.2 255.2 64.8 10.0 300.0 0.0 -225.2 0.0 0.0 255.2 255.2 30.0. 50.0 80,0 Nov-14 1500 Nov-14 Dec-14 3000 from forecast <80% of sales <-sales-cogs Dec-14 <-given <-7% of sales <-Gross profit-Depr - Other expense <-previous total borrowing (N/P+Long term debt) * monthly interest rate <--tax rate EBT <-- no dividend would be paid, or=0 <-net income dividend < previous N/P + Long-term debt + accumulated fund neede <-desired cash level at 80. given <-- from current monthly sales given by inventory policy <cash + A/R + Inventories < previous fixed asset-depreciation Total current asset + Fixed asset <-given,-0 <--given <-given <--plugin-total liabilities - fall other liabilities excluding cumulative additional fund needed) <-total asset-total equity < previous equity + addition to retained earnings <-- total asset (from balance sheet identity) < previous sales would be collected this month <from income statement <from income statement <-- from income statement <-- from income statement <-collection all expenses previous month cash <--target cash <target cash beginning cash-net monthly cash flow previous additional fund need + additiona fund need <- you need to match this number change in AR from previous month <- change in inventory from previous month <-no capital expenditure, given <-- no addition debt beside additional fund needed <additional funds needed <-- sum of items of cash flow from financing <-- cash from from operation + cash flow from investing + cash flow from financing <- beginning cash balance + net cash flow Q3 Q2 Q1 Forecasting Additional Fund needed using percentage of sales method Current Change Net sales Total assets Next period Sales growth rate NS1 AFN Accounts payable Accrued liabilities Net Income Retention ratio NS1 - NSO Change in TA, or ATA A (AP + AL) addition to retained earnings |(ATA) - A (AP+AL) - (addition to Retained earnings) NSO TAO APO ALO NIO RRO g NS0* (1+g) ANS (TAO/NSO) * ANS ((APO+ ALO)/ NSO) * ANS? (NS1* (NIO / NS0) * RRO) ? ? 20% Q3 Q2 Cash flow analysis 1. Number of cars sold 2. Unit price 3. Unit cost 4. Revenue 5. Cost of goods sold (1 x 3) 6. Wages and other costs 7. Depreciation 8. EBIT (4-5-6-7) 9. Net interest 10. Pretax proit (8-9). 11. Tax (.35 x 10) 12. Net proit (10-11) Balance sheet Cash Receivable Inventory Total current assets Fixed asset, net Total assets Bank loan Payables Total current liabilities Sharesholders equity Total liabilities plus equity Operation cash flow = EBIT -tax + Depr EBIT tax Depr Operation cash flow Q1 net capital spending change in net fixed asset + depr change in net fixed asset dper net capital spending (NCS) change in net operating working capital (NOWC) NOWC = CA- (CL-bank loan) Change in NOWC Cash flow from asset=OCF-NCS - Change in NOWC CFFA 2009Q1-202001 1150 100 90 23000 20700 750 400 1150 568 582 203.7 378.3 202001 10 10,500 5,400 15,910 1,280 17,190 9,731 5,400 15,131 2.059 17,190 ?? ?? ?? ?? ?? ?? ?? 3 2020Q1 ?? ?? ?? 201901 10 0 4.500 4,510 1,760 6,270 230 4,500 4,730 1.540 6,270 2019Q1 ?? 2008 Q4 250 20 18 5000 4500 200 80 220 4 216 75.6 140.4 Q1 200 20 18 4000 3600 150 80 170 0 170 59.5 110,5 Q2 200 20 18 4000 3600 150 80 170 76 94 32.9 61.1 2009 Q3 225 20 18 4500 4050 150 80 220 153 67 23.45 43.55 Q4 250 20 18 5000 4500 150 80 270 161 109 38.15 70.85 2020 Q1 275 20 18 5500 4950 150 80 320 178 142 49.7 92.3 Question 1: Cash budgeting and Pro-forma financial statement Short-Term Financial Planning] Artero Corporation is a traditional toy products retailer that recently also started an Internet-based subsidiary that sells toys online. A markup is added on goods the company purchases from manufacturers for resale. Swen Artero, the company president, is preparing for a meeting with Jennifer Brown, a loan officer with First Banco Corporation, to review year end financing requirements. After discussions with the company's marketing manager Rolf Eriksson and finance manager Lisa Erdinger, sales over the next three months were forecasted as follows. Month October 2014 November December Cash Accounts receivable Inventories Net fixed assets Total assets Artero's balance sheet as of the end of September, 2014 was as follows. Artero Corporation Balance Sheet as of September 30, 2014 (in S Thousands) $ 50 700 500 750 Sales Forecast ($000) $2,000 $1,000 1,500 3,000 Accounts payable Notes payable Long-term debt Total liabilities Equity Total $0 800 400 1,200 800 $2,000 All sales are made on credit terms of net 30 days and are collected the following month and no bad debts are anticipated. The accounts receivable on the balance sheet at the end of September thus will be collected in October. The October sales will be collected in November, and so on. Inventory on hand represents a minimum operating level (or "safety" stock), which the company intends to maintain. Cost of goods sold average 80 percent of sales. Inventory is purchased in the month of sale and paid for in cash. Other cash expenses average 7 percent of sales. Depreciation is $10,000 per month. Assume taxes are paid monthly and the effective income tax rate is 40 percent for planning purposes. The annual interest rate on outstanding long-term debt and bank loans (notes payable) is 12%. There are no capital expenditures planned during the period, and no dividends will be paid. The company's desired end-of-month cash balance is $80,000. The president hopes to meet any cash shortages during the period by increasing the firm's notes payable to the bank. The interest rate on new loans will be 12%. A. Prepare monthly pro forma income statements for October, November, and December, and for the quarter ending December 31, 2014. B. Prepare both a monthly cash budget and pro forma statements of cash flows for the October, November, and December 2014. C. Describe your findings and indicate the maximum amount of bank borrowing that is needed. Question 2. Capital budgeting with percentage of sales method The Minoso Corporation anticipates a 20 percent increase in sales for 2014 over its 2013 level. Minoso is currently operating at full capacity and thus expects to increase its investment in both current and fixed assets in order to support the increase in forecasted sales. Minoso Corporation Income Statement for December 31, 2013 (Thousands of Dollars) Sales Operating expenses EBIT Interest EBT Taxes (40%) Net income Cash dividends (40%) Added retained earnings $15,000 Cash Accounts receivable 1,800 Inventories -13,000 2,000 Balance Sheet as of December 31, 2013 (Thousands of Dollars) 1,600 960 384 $576 640 $ 1,000 2,000 2.200 400 Accounts payable Bank Loan Accrued liabilities $ 1,600 1,200 Total current assets Fixed assets, net Total assets Current Change Net sales Total assets Next period Sales growth rate NSI AFN Accounts payable Accrued liabilities Net Income Retention ratio 5,200 NS1 - NSO 6,800 $12,000 Estimate the additional funds needed (AFN) for 2013 using the formula or equation method that is based on constant "percent of sales" relationships. Change in TA, or ATA A (AP + AL) addition to retained earnings (ATA)-A (AP+AL) - (addition to Retained earnings) Total current liabilities. Long-term debt Common stock Retained earnings Total liabilities & equity NSO TAO APO ALO ΝΙΟ RRO g NSO*(1+g) ANS 20% (TAO/ NSO) ANS ((APO+ ALO)/ NSO) ANS? (NSI (NIO/NSO) * RRO)? * 4,600 2,200 2,400 2,800 $12,000 Question 3. Short-term financing planning Capstan Autos operated an East Coast dealership for a major Japanese car manufacturer. Capstan's owner, Sidney Capstan, attributed much of the business's success to its no-frills policy of competitive pricing and immediate cash payment. The business was basically a simple one the firm imported cars at the beginning of each quarter and paid the manufacturer at the end of the quarter. The revenues from the sale of these cars covered the payment to the manufacturer and the expenses of running the business, as well as providing Sidney Capstan with a good return on his equity investment. By the fourth quarter of 2018 sales were running at 250 cars a quarter. Since the average sale price of each car was about $20,000, this translated into quarterly revenues of 250 × $20,000-$5 mil- lion. The average cost to Capstan of each imported car was $18,000. After paying wages, rent, and other recurring costs of $200,000 per quarter and deducting depreciation of $80,000, the company was left with earnings before interest and taxes (EBIT) of $220,000 a quarter and net profits of $140,000. The year 2019 was not a happy year for car importers in the United States. Recession led to a general decline in auto sales, while the fall in the value of the dollar shaved profit margins for many dealers in imported cars. Capstan more than most firms foresaw the difficulties ahead and reacted at once by offering 6 months' free credit while holding the sale price of its cars constant. Wages and other costs were pared by 25% to $150,000 a quarter, and the company effectively eliminated all capital expenditures. The The year 2019 was not a happy year for car importers in the United States. Recession led to a general decline in auto sales, while the fall in the value of the dollar shaved profit margins for many dealers in imported cars. Capstan more than most firms foresaw the difficulties ahead and reacted at once by offering 6 months' free credit while holding the sale price of its cars constant. Wages and other costs were pared by 25% to $150,000 a quarter, and the company effectively eliminated all capital expenditures. The policy appeared successful. Unit sales fell by 20% to 200 units a quarter, but the company continued to operate at a satisfactory profit (see table). The slump in sales lasted for 6 months, but as consumer confidence began to return, auto sales began to recover. The company's new policy of 6 months' free credit was proving sufficiently popular that Sidney Capstan decided to maintain the policy. In the third quarter of 2019 sales had recovered to 225 units; by the fourth quarter they were 250 units; and by the first quarter of the next year they had reached 275 units. It looked as if by the second quarter of 2020 the company could expect to sell 300 cars. Earnings before interest and tax were already in excess of their previous high, and Sidney Capstan was able to congratulate himself on weathering what looked to be a tricky period. Over the 18- month period the firm had earned net profits of over half a million dollars, and the equity had grown from just over $1.5 million to about $2 million. Sidney Capstan was first and foremost a superb salesman and always left the financial aspects of the business to his financial manager. However, there was one feature of the financial statements that disturbed Sidney Capstan-the mounting level of debt, which by the end of the first quarter of 2020 had reached $9.7 million. This unease turned to alarm when the financial manager phoned to say that the bank was reluctant to extend further credit and was even questioning its current level of exposure to the company. Mr. Capstan found it impossible to understand how such a successful year could have landed the company in financial difficulties. The company had always had good relationships with its bank, and the interest rate on its bank loans was a reasonable 8% a year (or about 2% a quarter). Surely, Mr. Capstan reasoned, when the bank saw the projected sales growth for the rest of 2020, it would realize that there were plenty of profits to enable the company to start repaying its loans. Mr. Capstan kept coming back to three questions: 1) Was his company really in trouble? 2) Could the bank be right in its decision to withhold further credit? 3) And why was the company's indebtedness increasing when its profits were higher than ever? Please give your answer. 1. Number of cars sold 2. Unit price 3. Unit cost SUMMARY INCOME STATEMENT (All figures except unit sales in $ thousands) Year: 2018 2019 4 250 20 18 Quarter: 4. Revenues (1 x 2) 5. Cost of goods sold (1 x 3) 6. Wages and other costs 7. Depreciation 8. EBIT (4-5-6-7) 9. Net interest 10. Pretax profit (8-9) 5,000 4,500 200 80 220 4 216 1 200 20 18 4,000 3,600 150 80 170 0 170 2 4 200 250 20 20 18 18 4,000 4,500 5,000 3,600 4,050 4,500 150 150 150 80 80 80 220 153 3 225 20 18 170 76 94 67 270 161 109 2020 1 275 20 18 5,500 4,950 150 80 320 178 142 2) Could the bank be right in its decision to withhold further credit? 3) And why was the company's indebtedness increasing when its profits were higher than ever? Please give your answer. 1. Number of cars sold 2. Unit price 3. Unit cost 10. Pretax profit (8-9) 11. Tax (.35 x 10) 12. Net profit (10-11) 4. Revenues (1 x 2) 5. Cost of goods sold (1 x 3) 6. Wages and other costs 7. Depreciation 8. EBIT (4-5-6-7) 9. Net interest Cash Receivables Inventory SUMMARY INCOME STATEMENT (All figures except unit sales in $ thousands) Year: 2018 2019 4 250 20 18 Total current assets Fixed assets, net Total assets Bank loan Quarter: 5,000 4,500 200 80 220 4 216 76 140 Payables Total current liabilities Shareholders' equity Total liabilities plus equity 1 200 20 18 4,000 4,000 3,600 3,600 150 80 170 0 170 60 110 SUMMARY BALANCE SHEETS (Figures in $ thousands) 10 0 2 200 20 18 End of 3rd Quarter 2018 4,500 4,510 1,760 6,270 230 4,500 4,730 150 80 170 76 94 33 61 1,540 6,270 3 225 20 18 4,500 4,050 150 80 220 153 67 23 44 4 250 20 18. 5,000 4,500 150 80 270 161 109 38 71 10 10,500 5,400 15,910 2020 1 275 20 18 1,280 17,190 9,731 5,400 15,131 2,059 17,190 5,500 4,950 150 80 320 178 142 End of 1st Quarter 2020 50 92 Q3 Q2 Pro-forma financial statements Income statement Sales (S) Cogs (80% of 5) Gross Profit Depreciation Other expense (7% of S) EBIT Interest EBT Tax (40%) Net Income dividend addition to retained earnings previous total borrowings Balance sheet Q1 Cash A/R Inventories Total C/A Fixed Asset Total Asset A/P N/P LT debt cumulative additional Fund needed Total liabilities Equity Total liabilities & Equity Cash Budget (S in Thousands) Collection fom Recivables Purchases (cogs) Interest Payments Payment of Taxes Other Expense Net Monthly Cash Flow beginning cash cash balance required additional funds needed cumlative additional fund needed Statement of Cash Flow (S in Thousands) Net Income plus: Depreciation less: Increase In AR less: Increase In Inventory Cash flow from Operation Cash flow from investing Cash flow from Financing (excluding additional borrowing) Additional Funds Needed Total cash flow from financing Net Cash Flow Beginning Cash Balance - Ending Cash Balance Sep-14 Oct-14 700 1000 560 140 10 49 81 138 Sep-14 50 700 500 1250 750 2000 0 800 400 0 1200.00 800 2000 0 800.0 200.0 10.0 70.0 120.0 12.0 108.0 43.2 64.8 0.0 64.8 1,200.0 Oct-14 80.0 1,000.0 500.0 1,580.0 740.0 2,320.0 0.0 800.0 400.0 255.2 1,455.2 864.8 2,320.0 700.0 800.0 12.0 43.2 70.0 -225.2 50.0 80.0 255.2 255.2 64.8 10.0 300.0 0.0 -225.2 0.0 0.0 255.2 255.2 30.0. 50.0 80,0 Nov-14 1500 Nov-14 Dec-14 3000 from forecast <80% of sales <-sales-cogs Dec-14 <-given <-7% of sales <-Gross profit-Depr - Other expense <-previous total borrowing (N/P+Long term debt) * monthly interest rate <--tax rate EBT <-- no dividend would be paid, or=0 <-net income dividend < previous N/P + Long-term debt + accumulated fund neede <-desired cash level at 80. given <-- from current monthly sales given by inventory policy <cash + A/R + Inventories < previous fixed asset-depreciation Total current asset + Fixed asset <-given,-0 <--given <-given <--plugin-total liabilities - fall other liabilities excluding cumulative additional fund needed) <-total asset-total equity < previous equity + addition to retained earnings <-- total asset (from balance sheet identity) < previous sales would be collected this month <from income statement <from income statement <-- from income statement <-- from income statement <-collection all expenses previous month cash <--target cash <target cash beginning cash-net monthly cash flow previous additional fund need + additiona fund need <- you need to match this number change in AR from previous month <- change in inventory from previous month <-no capital expenditure, given <-- no addition debt beside additional fund needed <additional funds needed <-- sum of items of cash flow from financing <-- cash from from operation + cash flow from investing + cash flow from financing <- beginning cash balance + net cash flow Q3 Q2 Q1 Forecasting Additional Fund needed using percentage of sales method Current Change Net sales Total assets Next period Sales growth rate NS1 AFN Accounts payable Accrued liabilities Net Income Retention ratio NS1 - NSO Change in TA, or ATA A (AP + AL) addition to retained earnings |(ATA) - A (AP+AL) - (addition to Retained earnings) NSO TAO APO ALO NIO RRO g NS0* (1+g) ANS (TAO/NSO) * ANS ((APO+ ALO)/ NSO) * ANS? (NS1* (NIO / NS0) * RRO) ? ? 20% Q3 Q2 Cash flow analysis 1. Number of cars sold 2. Unit price 3. Unit cost 4. Revenue 5. Cost of goods sold (1 x 3) 6. Wages and other costs 7. Depreciation 8. EBIT (4-5-6-7) 9. Net interest 10. Pretax proit (8-9). 11. Tax (.35 x 10) 12. Net proit (10-11) Balance sheet Cash Receivable Inventory Total current assets Fixed asset, net Total assets Bank loan Payables Total current liabilities Sharesholders equity Total liabilities plus equity Operation cash flow = EBIT -tax + Depr EBIT tax Depr Operation cash flow Q1 net capital spending change in net fixed asset + depr change in net fixed asset dper net capital spending (NCS) change in net operating working capital (NOWC) NOWC = CA- (CL-bank loan) Change in NOWC Cash flow from asset=OCF-NCS - Change in NOWC CFFA 2009Q1-202001 1150 100 90 23000 20700 750 400 1150 568 582 203.7 378.3 202001 10 10,500 5,400 15,910 1,280 17,190 9,731 5,400 15,131 2.059 17,190 ?? ?? ?? ?? ?? ?? ?? 3 2020Q1 ?? ?? ?? 201901 10 0 4.500 4,510 1,760 6,270 230 4,500 4,730 1.540 6,270 2019Q1 ?? 2008 Q4 250 20 18 5000 4500 200 80 220 4 216 75.6 140.4 Q1 200 20 18 4000 3600 150 80 170 0 170 59.5 110,5 Q2 200 20 18 4000 3600 150 80 170 76 94 32.9 61.1 2009 Q3 225 20 18 4500 4050 150 80 220 153 67 23.45 43.55 Q4 250 20 18 5000 4500 150 80 270 161 109 38.15 70.85 2020 Q1 275 20 18 5500 4950 150 80 320 178 142 49.7 92.3 Question 1: Cash budgeting and Pro-forma financial statement Short-Term Financial Planning] Artero Corporation is a traditional toy products retailer that recently also started an Internet-based subsidiary that sells toys online. A markup is added on goods the company purchases from manufacturers for resale. Swen Artero, the company president, is preparing for a meeting with Jennifer Brown, a loan officer with First Banco Corporation, to review year end financing requirements. After discussions with the company's marketing manager Rolf Eriksson and finance manager Lisa Erdinger, sales over the next three months were forecasted as follows. Month October 2014 November December Cash Accounts receivable Inventories Net fixed assets Total assets Artero's balance sheet as of the end of September, 2014 was as follows. Artero Corporation Balance Sheet as of September 30, 2014 (in S Thousands) $ 50 700 500 750 Sales Forecast ($000) $2,000 $1,000 1,500 3,000 Accounts payable Notes payable Long-term debt Total liabilities Equity Total $0 800 400 1,200 800 $2,000 All sales are made on credit terms of net 30 days and are collected the following month and no bad debts are anticipated. The accounts receivable on the balance sheet at the end of September thus will be collected in October. The October sales will be collected in November, and so on. Inventory on hand represents a minimum operating level (or "safety" stock), which the company intends to maintain. Cost of goods sold average 80 percent of sales. Inventory is purchased in the month of sale and paid for in cash. Other cash expenses average 7 percent of sales. Depreciation is $10,000 per month. Assume taxes are paid monthly and the effective income tax rate is 40 percent for planning purposes. The annual interest rate on outstanding long-term debt and bank loans (notes payable) is 12%. There are no capital expenditures planned during the period, and no dividends will be paid. The company's desired end-of-month cash balance is $80,000. The president hopes to meet any cash shortages during the period by increasing the firm's notes payable to the bank. The interest rate on new loans will be 12%. A. Prepare monthly pro forma income statements for October, November, and December, and for the quarter ending December 31, 2014. B. Prepare both a monthly cash budget and pro forma statements of cash flows for the October, November, and December 2014. C. Describe your findings and indicate the maximum amount of bank borrowing that is needed. Question 2. Capital budgeting with percentage of sales method The Minoso Corporation anticipates a 20 percent increase in sales for 2014 over its 2013 level. Minoso is currently operating at full capacity and thus expects to increase its investment in both current and fixed assets in order to support the increase in forecasted sales. Minoso Corporation Income Statement for December 31, 2013 (Thousands of Dollars) Sales Operating expenses EBIT Interest EBT Taxes (40%) Net income Cash dividends (40%) Added retained earnings $15,000 Cash Accounts receivable 1,800 Inventories -13,000 2,000 Balance Sheet as of December 31, 2013 (Thousands of Dollars) 1,600 960 384 $576 640 $ 1,000 2,000 2.200 400 Accounts payable Bank Loan Accrued liabilities $ 1,600 1,200 Total current assets Fixed assets, net Total assets Current Change Net sales Total assets Next period Sales growth rate NSI AFN Accounts payable Accrued liabilities Net Income Retention ratio 5,200 NS1 - NSO 6,800 $12,000 Estimate the additional funds needed (AFN) for 2013 using the formula or equation method that is based on constant "percent of sales" relationships. Change in TA, or ATA A (AP + AL) addition to retained earnings (ATA)-A (AP+AL) - (addition to Retained earnings) Total current liabilities. Long-term debt Common stock Retained earnings Total liabilities & equity NSO TAO APO ALO ΝΙΟ RRO g NSO*(1+g) ANS 20% (TAO/ NSO) ANS ((APO+ ALO)/ NSO) ANS? (NSI (NIO/NSO) * RRO)? * 4,600 2,200 2,400 2,800 $12,000 Question 3. Short-term financing planning Capstan Autos operated an East Coast dealership for a major Japanese car manufacturer. Capstan's owner, Sidney Capstan, attributed much of the business's success to its no-frills policy of competitive pricing and immediate cash payment. The business was basically a simple one the firm imported cars at the beginning of each quarter and paid the manufacturer at the end of the quarter. The revenues from the sale of these cars covered the payment to the manufacturer and the expenses of running the business, as well as providing Sidney Capstan with a good return on his equity investment. By the fourth quarter of 2018 sales were running at 250 cars a quarter. Since the average sale price of each car was about $20,000, this translated into quarterly revenues of 250 × $20,000-$5 mil- lion. The average cost to Capstan of each imported car was $18,000. After paying wages, rent, and other recurring costs of $200,000 per quarter and deducting depreciation of $80,000, the company was left with earnings before interest and taxes (EBIT) of $220,000 a quarter and net profits of $140,000. The year 2019 was not a happy year for car importers in the United States. Recession led to a general decline in auto sales, while the fall in the value of the dollar shaved profit margins for many dealers in imported cars. Capstan more than most firms foresaw the difficulties ahead and reacted at once by offering 6 months' free credit while holding the sale price of its cars constant. Wages and other costs were pared by 25% to $150,000 a quarter, and the company effectively eliminated all capital expenditures. The The year 2019 was not a happy year for car importers in the United States. Recession led to a general decline in auto sales, while the fall in the value of the dollar shaved profit margins for many dealers in imported cars. Capstan more than most firms foresaw the difficulties ahead and reacted at once by offering 6 months' free credit while holding the sale price of its cars constant. Wages and other costs were pared by 25% to $150,000 a quarter, and the company effectively eliminated all capital expenditures. The policy appeared successful. Unit sales fell by 20% to 200 units a quarter, but the company continued to operate at a satisfactory profit (see table). The slump in sales lasted for 6 months, but as consumer confidence began to return, auto sales began to recover. The company's new policy of 6 months' free credit was proving sufficiently popular that Sidney Capstan decided to maintain the policy. In the third quarter of 2019 sales had recovered to 225 units; by the fourth quarter they were 250 units; and by the first quarter of the next year they had reached 275 units. It looked as if by the second quarter of 2020 the company could expect to sell 300 cars. Earnings before interest and tax were already in excess of their previous high, and Sidney Capstan was able to congratulate himself on weathering what looked to be a tricky period. Over the 18- month period the firm had earned net profits of over half a million dollars, and the equity had grown from just over $1.5 million to about $2 million. Sidney Capstan was first and foremost a superb salesman and always left the financial aspects of the business to his financial manager. However, there was one feature of the financial statements that disturbed Sidney Capstan-the mounting level of debt, which by the end of the first quarter of 2020 had reached $9.7 million. This unease turned to alarm when the financial manager phoned to say that the bank was reluctant to extend further credit and was even questioning its current level of exposure to the company. Mr. Capstan found it impossible to understand how such a successful year could have landed the company in financial difficulties. The company had always had good relationships with its bank, and the interest rate on its bank loans was a reasonable 8% a year (or about 2% a quarter). Surely, Mr. Capstan reasoned, when the bank saw the projected sales growth for the rest of 2020, it would realize that there were plenty of profits to enable the company to start repaying its loans. Mr. Capstan kept coming back to three questions: 1) Was his company really in trouble? 2) Could the bank be right in its decision to withhold further credit? 3) And why was the company's indebtedness increasing when its profits were higher than ever? Please give your answer. 1. Number of cars sold 2. Unit price 3. Unit cost SUMMARY INCOME STATEMENT (All figures except unit sales in $ thousands) Year: 2018 2019 4 250 20 18 Quarter: 4. Revenues (1 x 2) 5. Cost of goods sold (1 x 3) 6. Wages and other costs 7. Depreciation 8. EBIT (4-5-6-7) 9. Net interest 10. Pretax profit (8-9) 5,000 4,500 200 80 220 4 216 1 200 20 18 4,000 3,600 150 80 170 0 170 2 4 200 250 20 20 18 18 4,000 4,500 5,000 3,600 4,050 4,500 150 150 150 80 80 80 220 153 3 225 20 18 170 76 94 67 270 161 109 2020 1 275 20 18 5,500 4,950 150 80 320 178 142 2) Could the bank be right in its decision to withhold further credit? 3) And why was the company's indebtedness increasing when its profits were higher than ever? Please give your answer. 1. Number of cars sold 2. Unit price 3. Unit cost 10. Pretax profit (8-9) 11. Tax (.35 x 10) 12. Net profit (10-11) 4. Revenues (1 x 2) 5. Cost of goods sold (1 x 3) 6. Wages and other costs 7. Depreciation 8. EBIT (4-5-6-7) 9. Net interest Cash Receivables Inventory SUMMARY INCOME STATEMENT (All figures except unit sales in $ thousands) Year: 2018 2019 4 250 20 18 Total current assets Fixed assets, net Total assets Bank loan Quarter: 5,000 4,500 200 80 220 4 216 76 140 Payables Total current liabilities Shareholders' equity Total liabilities plus equity 1 200 20 18 4,000 4,000 3,600 3,600 150 80 170 0 170 60 110 SUMMARY BALANCE SHEETS (Figures in $ thousands) 10 0 2 200 20 18 End of 3rd Quarter 2018 4,500 4,510 1,760 6,270 230 4,500 4,730 150 80 170 76 94 33 61 1,540 6,270 3 225 20 18 4,500 4,050 150 80 220 153 67 23 44 4 250 20 18. 5,000 4,500 150 80 270 161 109 38 71 10 10,500 5,400 15,910 2020 1 275 20 18 1,280 17,190 9,731 5,400 15,131 2,059 17,190 5,500 4,950 150 80 320 178 142 End of 1st Quarter 2020 50 92
Expert Answer:
Answer rating: 100% (QA)
Question 1 Cash Budgeting and Proforma Financial Statement A Proforma Income Statements Month October 2014 November 2014 December 2014 Quarter Ending December 31 2014 Sales 1000 1500 3000 5500 COGS 80... View the full answer

Related Book For 

Posted Date:
Students also viewed these accounting questions
-
Sue Wilson is the new financial manager of Northwest Chemicals (NWC), an Oregon producer of specialized chemicals that are sold to farmers for use in fruit orchards. She is responsible for...
-
Sue Wilson is the new financial manager of Northwest Chemicals (NWC), an Oregon producer of specialized chemicals that are sold to farmers for use in fruit orchards. She is responsible for...
-
Use Dynastatics' pro forma income statements and balance sheet from problem 32(a) to assess the cash flows for each forecast year. a. What is the capital expenditure each year? b. Start the statement...
-
All of the following represent trends shaping HR over the past decade, according to our reading, except: Organizations are spending more on the expansion of physical office space Employees are...
-
You are about to purchaseyour first home and receive an advertisement regarding adjustable-rate mortgages (ARMs). The interest rate on the ARM is lower than that on a fixed rate mortgage. The...
-
Given the following information, calculate the cost to consumers, the benefit to producers, the change in government revenue, and the deadweight costs of a proposed 10 percent tariff on personal...
-
In flowing from section (1) to section (2) along an open channel, the water depth decreases by a factor of 2 and the Froude number changes from a subcritical value of 0.5 to a supercritical value of...
-
RL Photography reported net income of $100,000 for 2014. Included in the income statement were depreciation expense of $6,300, patent amortization expense of $4,000, and a gain on disposal of plant...
-
1. Evaluate the performance management appeals process and its connection to the employee performance. very important no to give short answers very important to give a detailed explanation very...
-
The variables x and u are related by ux = 2. The variable y is dependent on x. a. Show that b. Show also that reduces to 16d 2 y/du 2 8 dy/du + y = u and find the general solution in the form y =...
-
Dr. Doolittle finally finishes medical school and his internship and takes a job in the wilds of Alaska where he earns $70,000. He has no other income. Since there is no place for him to spend his...
-
One way to measure the strength of a magnetic field is with a flip coil. Suppose a 200 turn, 4.0 cm diameter with a resistance of 2.0 is connected to a 1.0 F capacitor. The coil is held perpendicular...
-
Which Regional and International Laws does Raza Hussain KC argue the Nationality and Borders Act (2022) contravenes? Identify which is a Regional Law and which is an International Law in your answer.
-
What is the term describing when people give freely to their partner without expecting anything in return?
-
How do emergent social movements challenge entrenched power structures and catalyze transformative societal shifts?
-
How do intersectional approaches to social change account for the multifaceted nature of oppression and privilege, thus necessitating nuanced strategies for dismantling systemic injustices?
-
. If a motor is suppling 100 Watts of power to a pump, and the pump is causing 68 Watts of power to be transferred to the liquid in the pump, what is the pump efficiency of the setup? (answer as a %)
-
Making use of the tables of atomic masses, find the velocity with which the products of the reaction B10 (n, ) Li7 come apart; the reaction proceeds via interaction of very slow neutrons with...
-
Sam Rothstein wants borrow $15,500 to be repaid in quarterly installments over five years at 16% compounded quarterly. How much will his payment be?
-
Speculate on the nature of the relationship between the credit and collections department and the sales department at Wachusett Window in the last two questions.
-
Why don't we calculate the total difference in the equity accounts between the beginning and end of the year and consider that difference as a source or use of cash? Why do we similarly exclude the...
-
The equivalent systems method can be used to derive the differential equation for linear SDOF systems with viscous damping. Indicate whether the statement presented is true or false. If true, state...
-
The inertia effects of a simply supported beam can be approximated by placing a particle of mass one-third of the mass of the beam at the midspan of the beam. Indicate whether the statement presented...
-
Energy dissipation is used to calculate the equivalent viscous-damping coefficient for a combination of viscous dampers. Indicate whether the statement presented is true or false. If true, state why....

Study smarter with the SolutionInn App