

Question: Q3: Same problem background as Q1 Use a One-way ANOVA approach to determine if there is equality between the pull tests for all the three
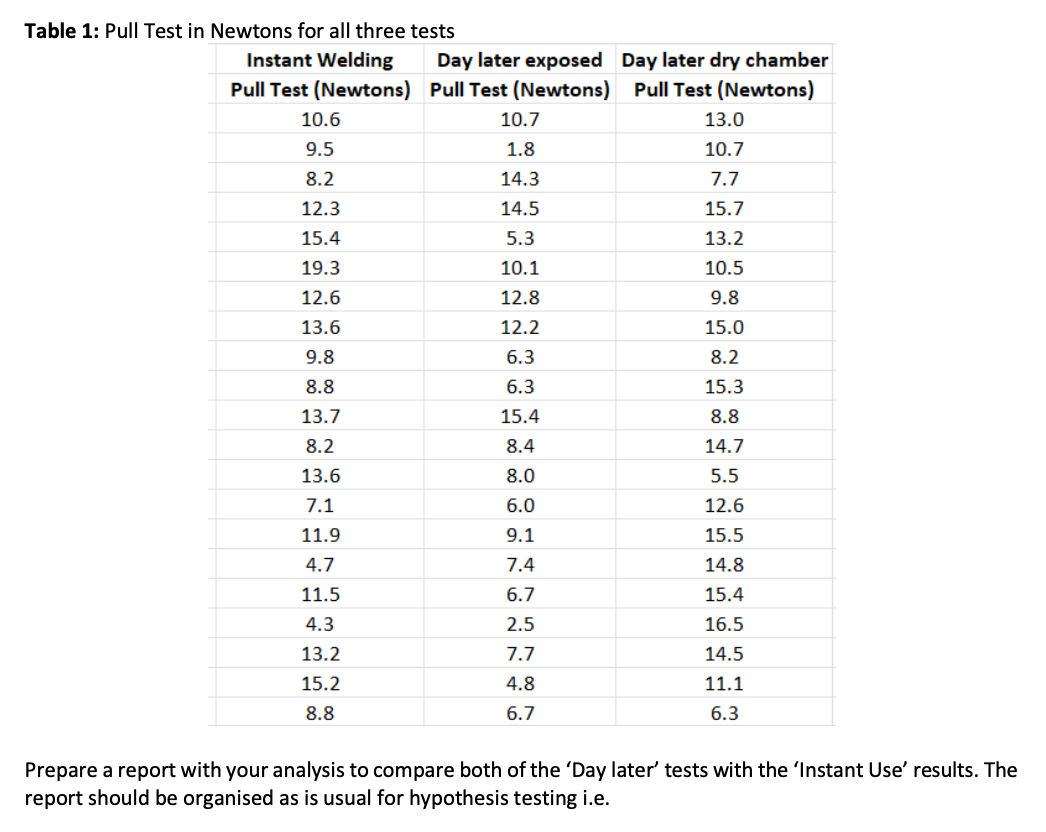
Q3: Same problem background as Q1 Use a One-way ANOVA approach to determine if there is equality between the pull tests for all the three samples provided in Table 1. The conclusion you present here should be in agreement with what you found in Q1 but will not be the same. Prepare a report with your analysis to contrast the three pull strength results. The report should be organised as is usual for hypothesis testing i.e. - STATE - state the hypothesis and alternative hypothesis - PLAN - Discuss the method and test adopted (Random, Independence (x10), normality (n>30)) and assumptions. - DO - Do the maths and evaluate results - CONCLUDE - Usually a technical conclusion a plain English one Use the p-value statistic to take the conclusions. You can make use of Microsfot Excel, take snippets of the calculations and insert in your document as figures. Table 1: Pull Test i Prepare a report with your analysis to compare both of the 'Day later' tests with the 'Instant Use' results. The report should be organised as is usual for hypothesis testing i.e. Q3: Same problem background as Q1 Use a One-way ANOVA approach to determine if there is equality between the pull tests for all the three samples provided in Table 1. The conclusion you present here should be in agreement with what you found in Q1 but will not be the same. Prepare a report with your analysis to contrast the three pull strength results. The report should be organised as is usual for hypothesis testing i.e. - STATE - state the hypothesis and alternative hypothesis - PLAN - Discuss the method and test adopted (Random, Independence (x10), normality (n>30)) and assumptions. - DO - Do the maths and evaluate results - CONCLUDE - Usually a technical conclusion a plain English one Use the p-value statistic to take the conclusions. You can make use of Microsfot Excel, take snippets of the calculations and insert in your document as figures. Table 1: Pull Test i Prepare a report with your analysis to compare both of the 'Day later' tests with the 'Instant Use' results. The report should be organised as is usual for hypothesis testing i.e
Step by Step Solution
There are 3 Steps involved in it

Get step-by-step solutions from verified subject matter experts