

Question: Q3 Short Answer Questions {9 points) Here is a box plot of (the simulated) age of students in a graduate class. 20 22 24 26
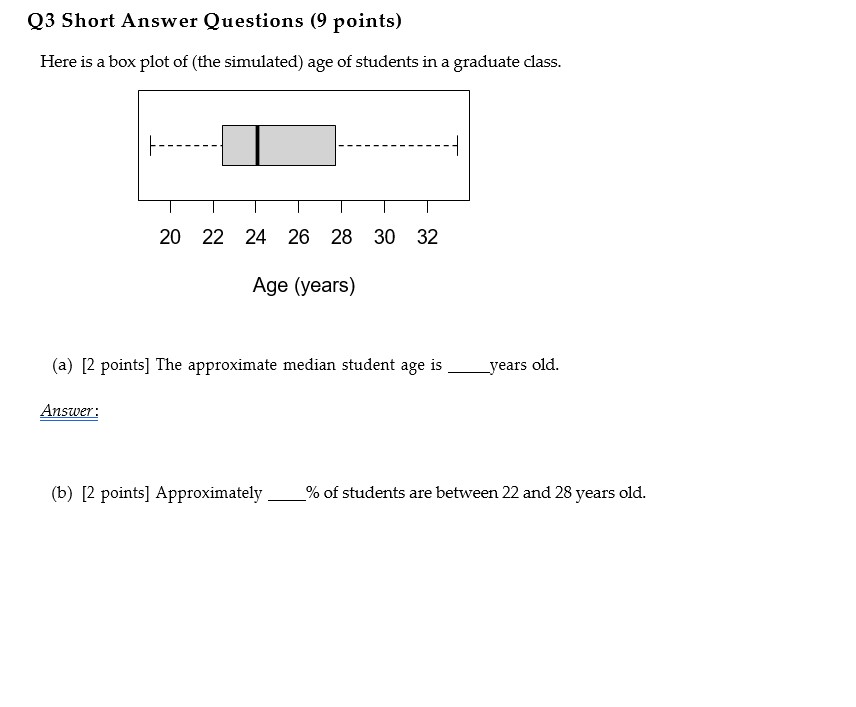
![24 26 28 30 32 Age (years) (a) [2 points] The approximate](https://s3.amazonaws.com/si.experts.images/answers/2024/06/6679c2f727665_7996679c2f70e2aa.jpg)
![median student age is years old. Answer: (b) [2 points] Approximately 9%:](https://s3.amazonaws.com/si.experts.images/answers/2024/06/6679c2f7a25a9_7996679c2f788be7.jpg)
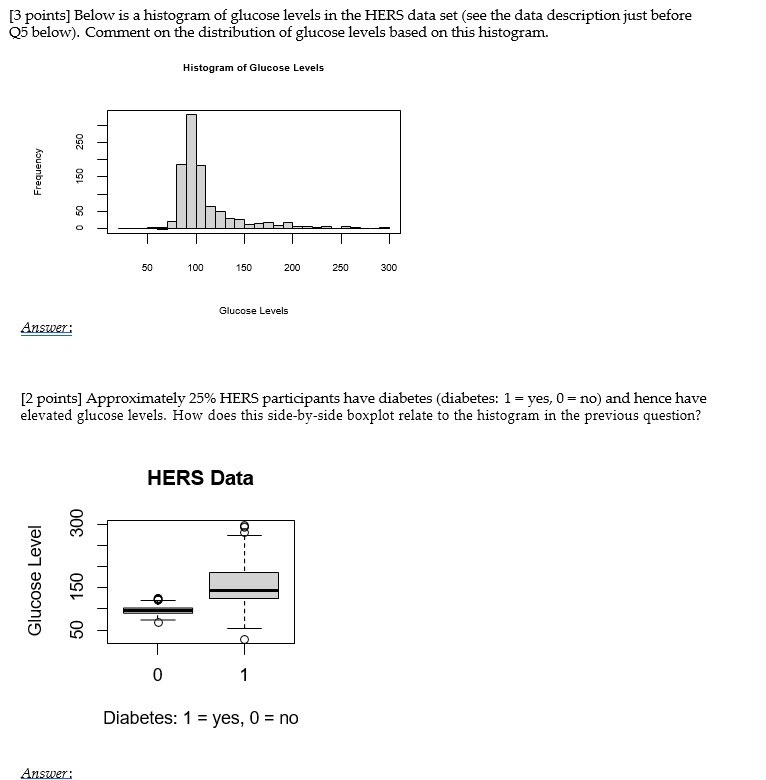
Q3 Short Answer Questions {9 points) Here is a box plot of (the simulated) age of students in a graduate class. 20 22 24 26 28 30 32 Age (years) (a) [2 points] The approximate median student age is years old. Answer: (b) [2 points] Approximately 9%: of students are between 22 and 28 years old. [3 points] Below is a histogram of glucose levels in the HERS data set (see the data description just before Q5 below). Comment on the distribution of glucose levels based on this histogram. Histogram of Glucose Levels 250 Frequency 150 50 50 100 150 200 250 300 Glucose Levels Answer : 12 points] Approximately 25% HERS participants have diabetes (diabetes: 1 = yes, 0 = no) and hence have elevated glucose levels. How does this side-by-side boxplot relate to the histogram in the previous question? HERS Data 300 Glucose Level 50 150 Q 0 Diabetes: 1 = yes, 0 = no
Step by Step Solution
There are 3 Steps involved in it

Get step-by-step solutions from verified subject matter experts