

Question: Q3. Slide 3: Create a table shown as below (1.5 marks) Set the title: WSJ Financial Highlights Print WSJ Electronic WSJ Advertising 790 204 Information
Q3. Slide 3: Create a table shown as below (1.5 marks) Set the title: WSJ Financial Highlights Print WSJ Electronic WSJ Advertising 790 204 Information Services 670 263 Dow Jones Newswires 29 159 Operating Expenses 896 302 Operating Income 247 61 Q4. Slide 4: a) Use the data from Slide 3 to create a Column Chart shown as below (2.5 marks) b) Set Chart Title (not slide title): WSJ Financial Highlights (0.5 marks) c) Set Vertical Axis Title: ($ Millions) (0.5 marks) d) Show Legend on the bottom (0.5 marks) e) Show Vertical Major Gridlines (0.5 marks)
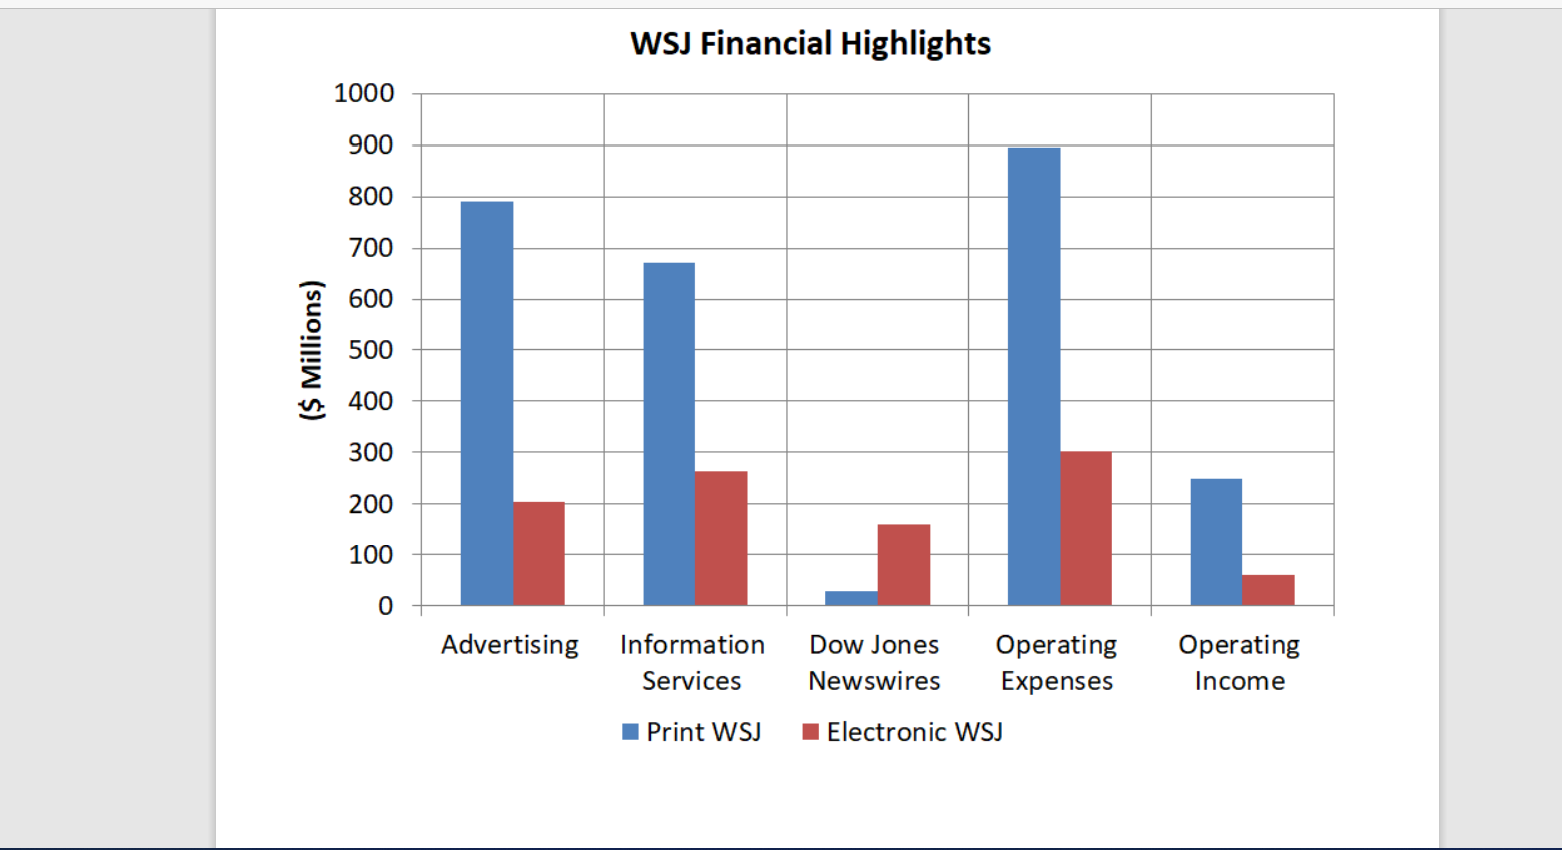
WSJ Financial Highlights 1000 900 800 700 600 ($ Millions) 500 400 300 200 100 L Advertising Information Services Dow Jones Operating Newswires Expenses Electronic WSJ Operating Income Print WSJ
Step by Step Solution
There are 3 Steps involved in it

Get step-by-step solutions from verified subject matter experts