

Question: Q3: The graph of the function f(a) is shown in the plot below. 4 A U (x) 2 4 6 8 10 X -2- -4-
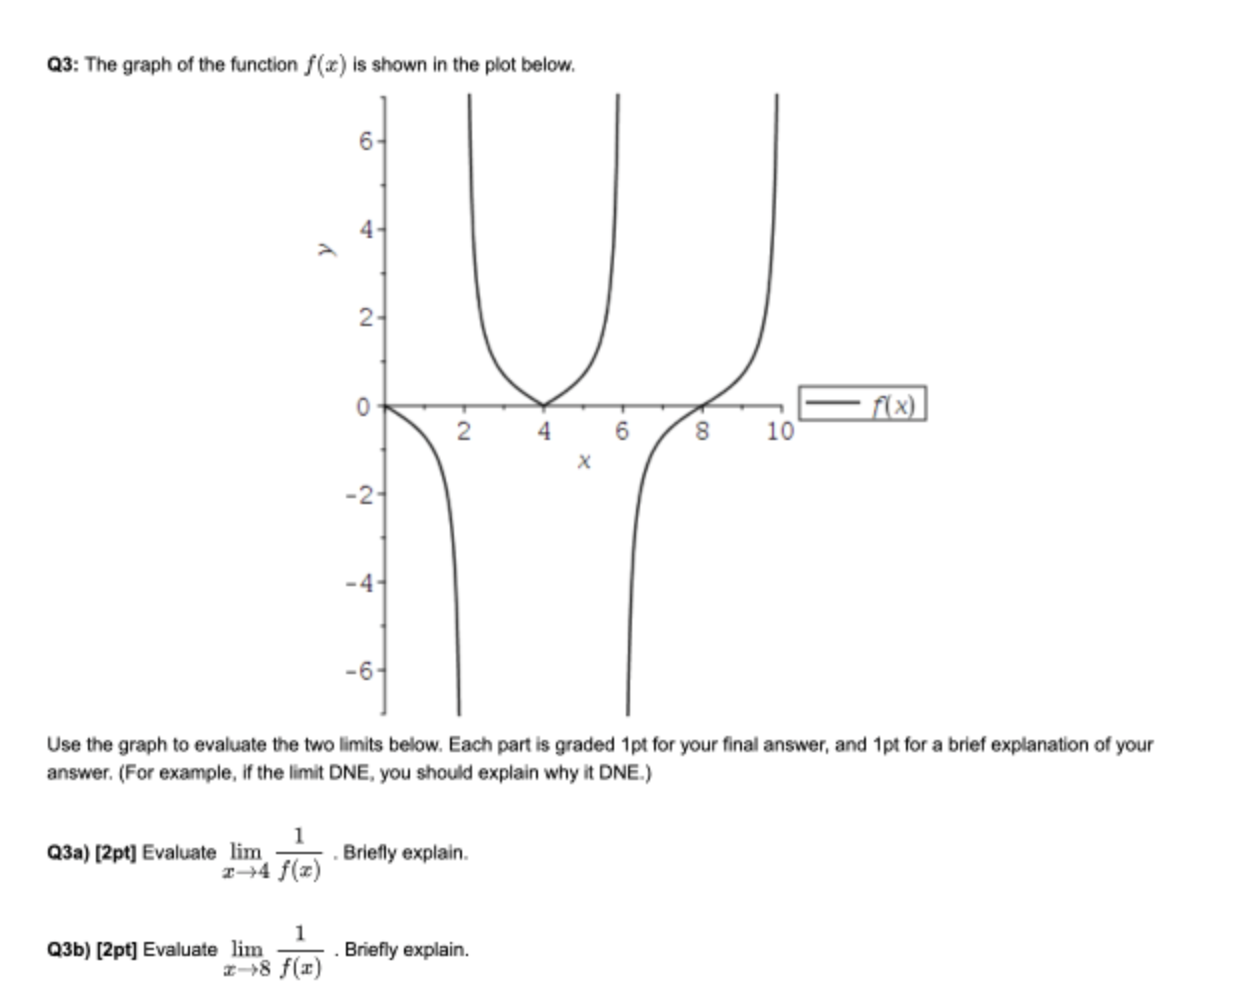
Q3: The graph of the function f(a) is shown in the plot below. 4 A U (x) 2 4 6 8 10 X -2- -4- -6- Use the graph to evaluate the two limits below. Each part is graded 1pt for your final answer, and 1pt for a brief explanation of your answer. (For example, if the limit DNE, you should explain why it DNE.) Q3a) [2pt] Evaluate lim . Briefly explain. Q3b) [2pt] Evaluate lim 1 Briefly explain
Step by Step Solution
There are 3 Steps involved in it
1 Expert Approved Answer
Step: 1 Unlock

Question Has Been Solved by an Expert!
Get step-by-step solutions from verified subject matter experts
Step: 2 Unlock
Step: 3 Unlock