

Question: Q.3 The table below shows cost data for four different -sized plants - 1, 2, 3 and 4, which are the only four sizes possible.
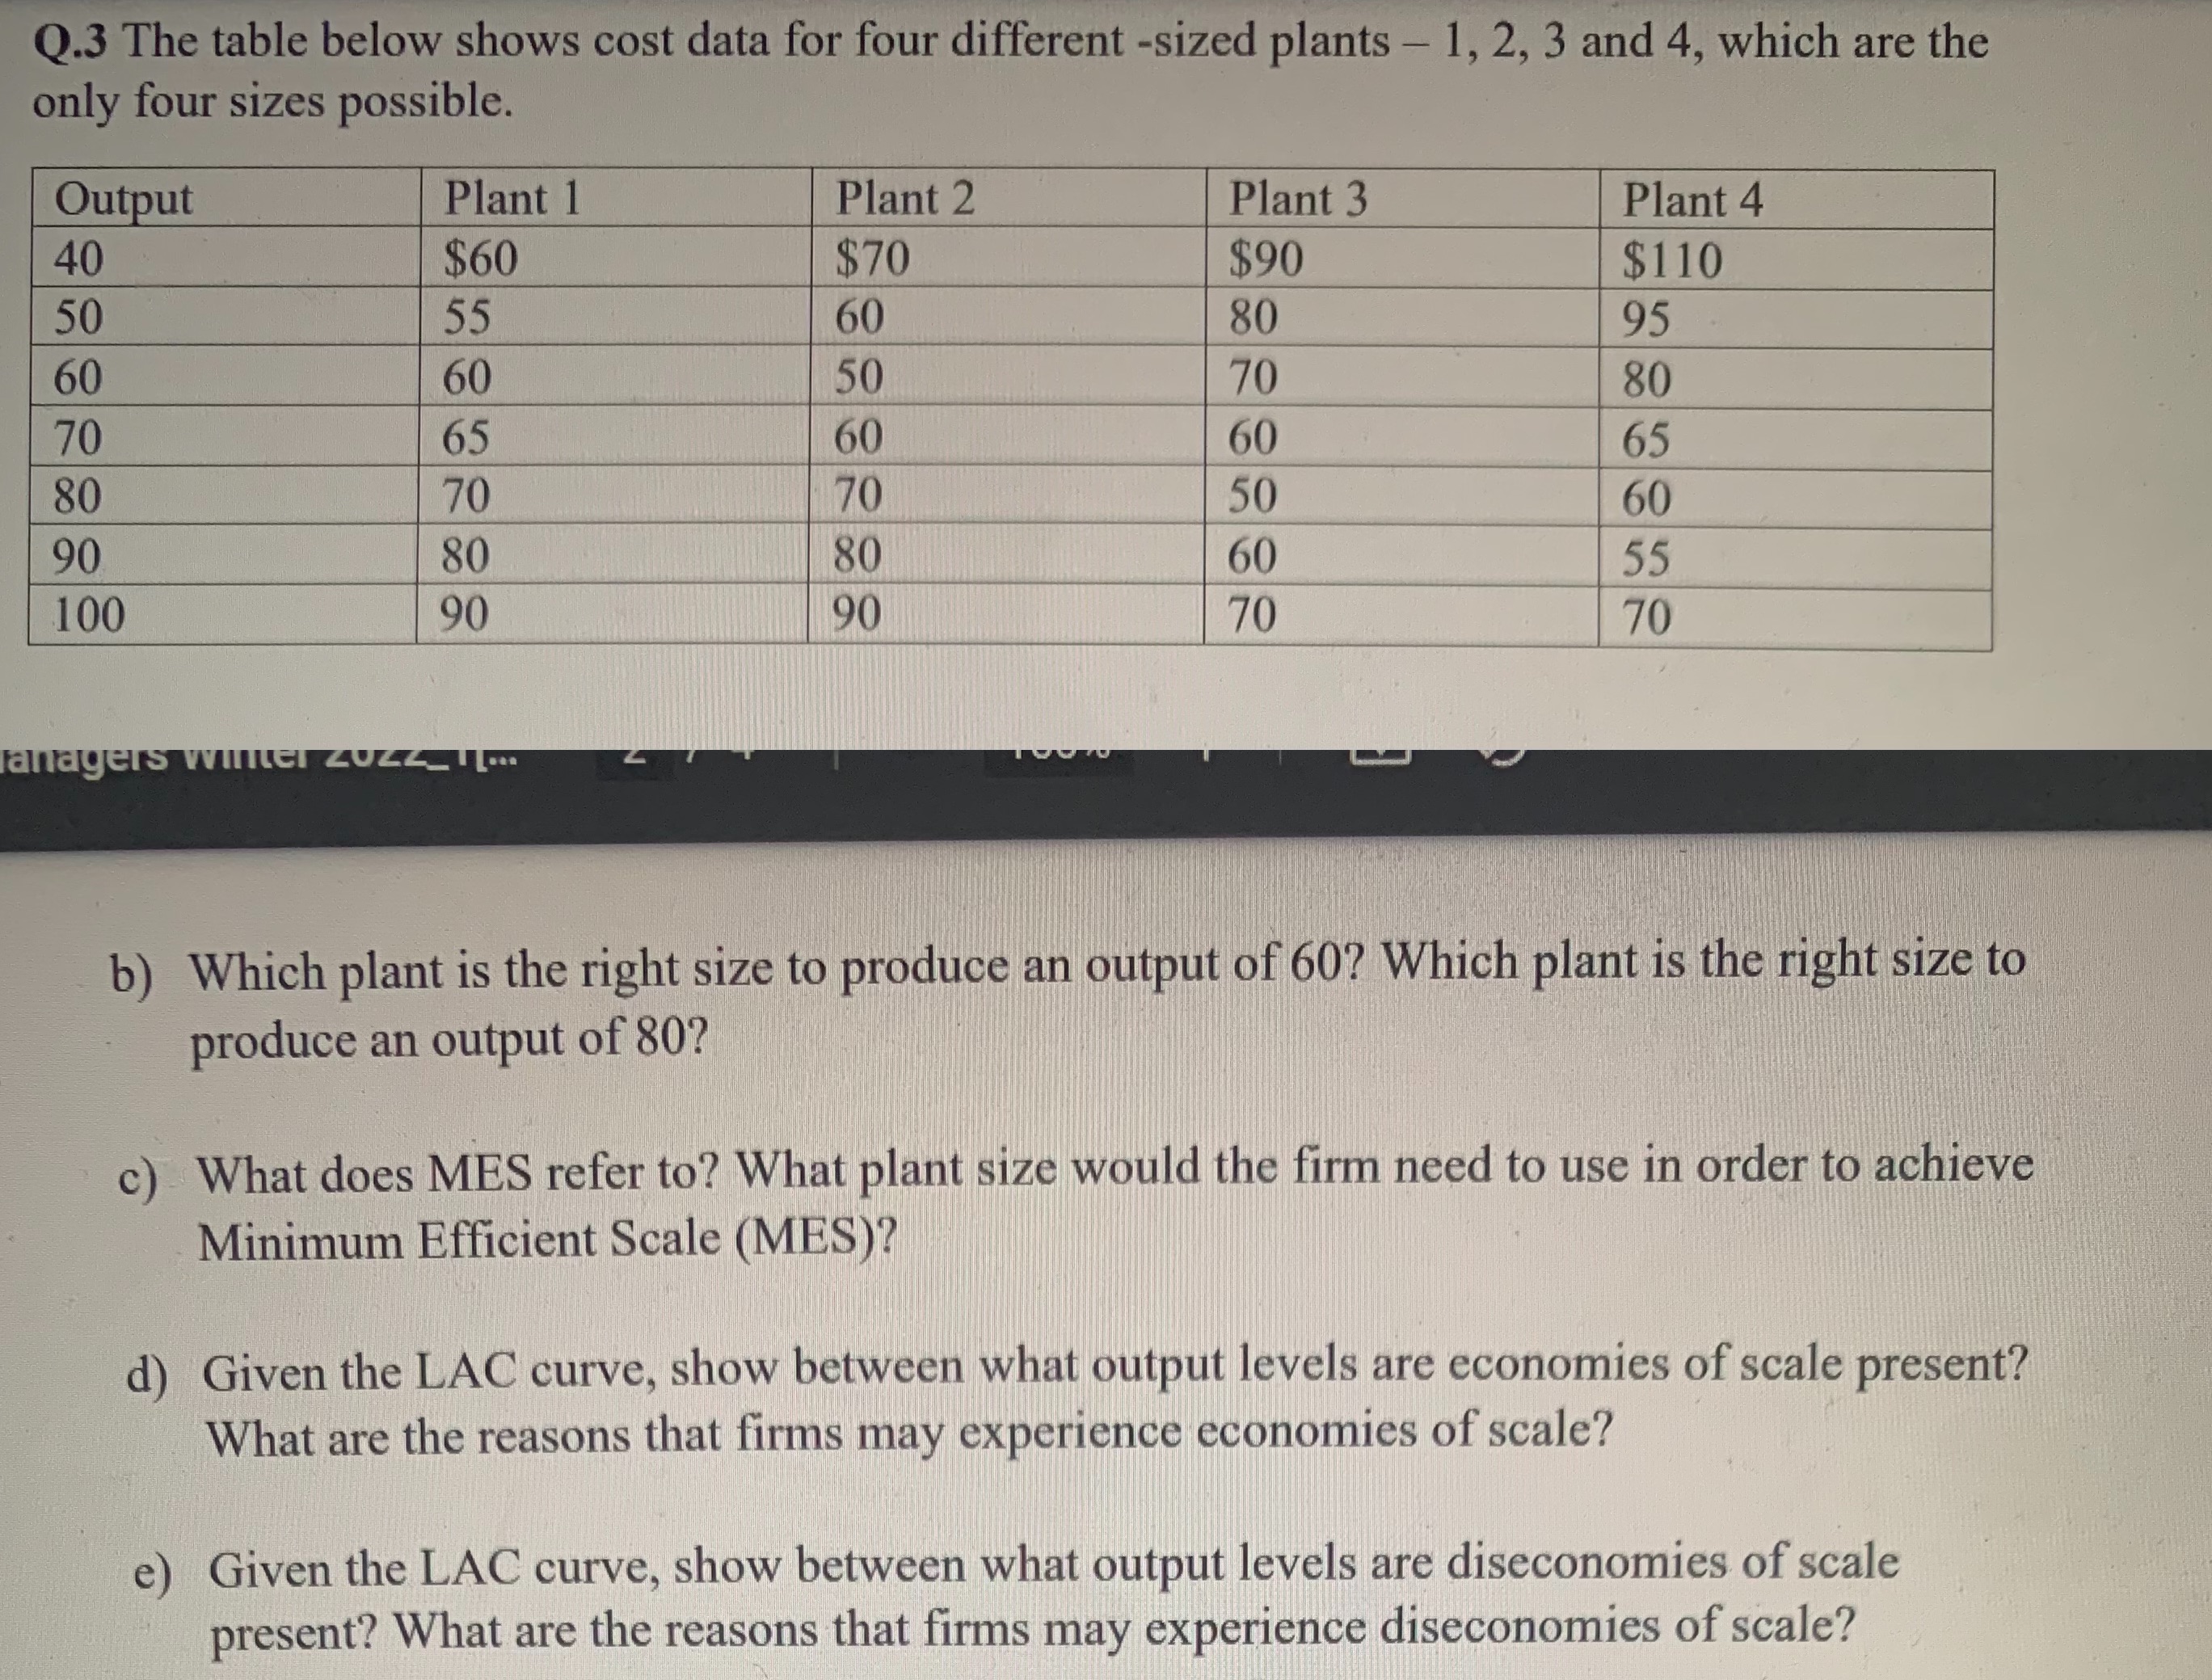
Q.3 The table below shows cost data for four different -sized plants - 1, 2, 3 and 4, which are the only four sizes possible. Output Plant 1 Plant 2 Plant 3 40 Plant 4 $60 $70 $90 50 55 $110 60 80 60 95 60 50 70 70 80 65 60 60 80 65 70 70 50 90 60 80 80 60 100 55 90 90 70 70 anagers winter zuzz_IT... b) Which plant is the right size to produce an output of 60? Which plant is the right size to produce an output of 80? c) What does MES refer to? What plant size would the firm need to use in order to achieve Minimum Efficient Scale (MES)? d) Given the LAC curve, show between what output levels are economies of scale present? What are the reasons that firms may experience economies of scale? e) Given the LAC curve, show between what output levels are diseconomies of scale present? What are the reasons that firms may experience diseconomies of scale
Step by Step Solution
There are 3 Steps involved in it

Get step-by-step solutions from verified subject matter experts