

Question: Q3. There is only this one hw assignment for lect20. However, it has many parts. Also, your answer to part b will effect many of
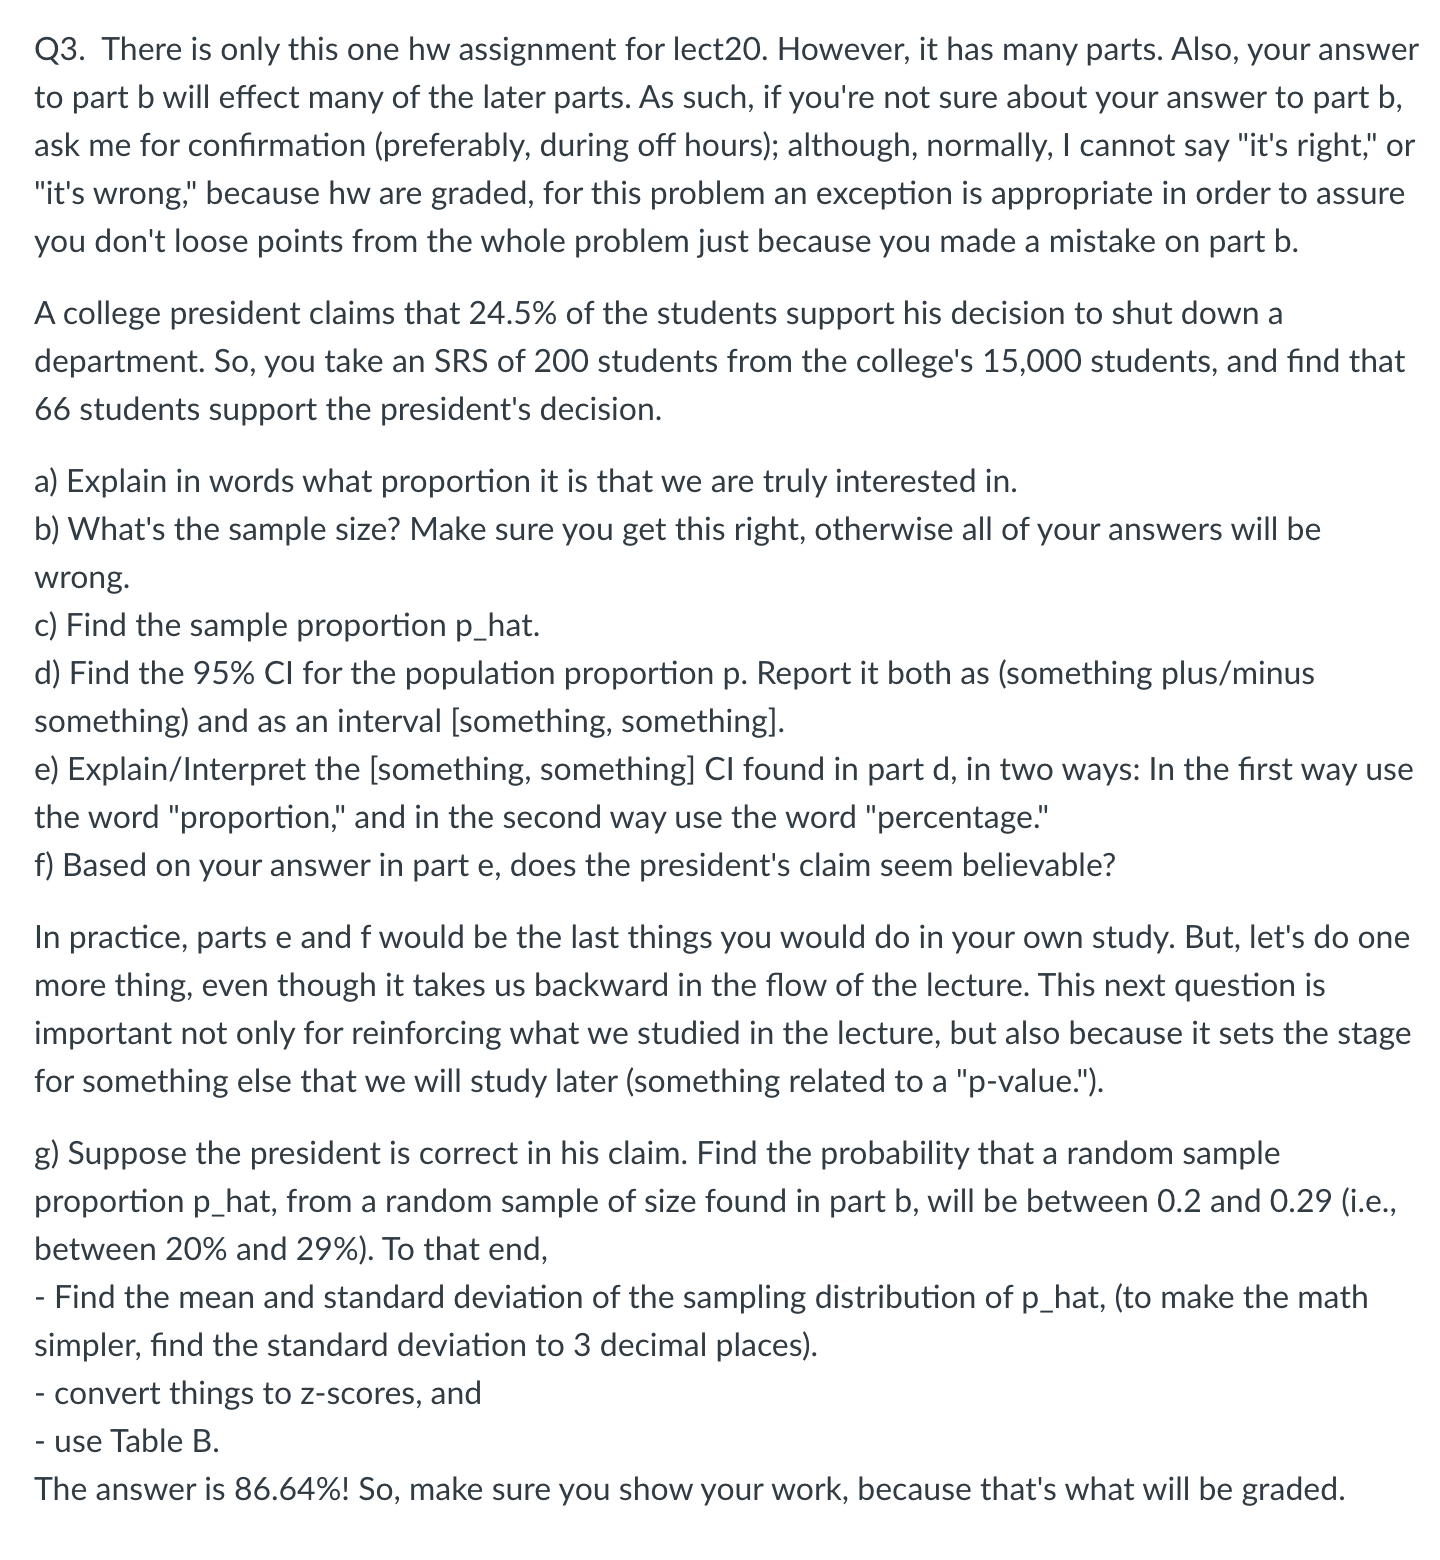
Q3. There is only this one hw assignment for lect20. However, it has many parts. Also, your answer to part b will effect many of the later parts. As such, if you're not sure about your answer to part b, ask me for conrmation (preferably, during off hours); although, normally, I cannot say "it's right," or "it's wrong," because hw are graded, for this problem an exception is appropriate in order to assure you don't loose points from the whole problem just because you made a mistake on part b. A college president claims that 24.5% of the students support his decision to shut down a department. 50, you take an SRS of 200 students from the college's 15,000 students, and nd that 66 students support the president's decision. a) Explain in words what proportion it is that we are truly interested in. b) What's the sample size? Make sure you get this right, otherwise all of your answers will be wrong. c) Find the sample proportion p_hat. d) Find the 95% CI for the population proportion p. Report it both as (something plus/minus something) and as an interval [something something]. e) Explain/Interpret the [something, something] Cl found in part d, in two ways: In the rst way use the word "proportion," and in the second way use the word "percentage." f) Based on your answer in part e, does the president's claim seem believable? In practice, parts e and fwould be the last things you would do in your own study. But, let's do one more thing, even though it takes us backward in the ow of the lecture. This next question is important not only for reinforcing what we studied in the lecture, but also because it sets the stage for something else that we will study later (something related to a "p-value."). g) Suppose the president is correct in his claim. Find the probability that a random sample proportion p_hat, from a random sample of size found in part b, will be between 0.2 and 0.29 (i.e., between 20% and 29%). To that end, - Find the mean and standard deviation of the sampling distribution of p_hat, (to make the math simpler, nd the standard deviation to 3 decimal places). - convert things to z-scores, and - use Table B. The answer is 86.64%! So, make sure you show your work, because that's what will be graded
Step by Step Solution
There are 3 Steps involved in it

Get step-by-step solutions from verified subject matter experts