

Question: Q3) Use y = 3.52x - 4.16 to plot the two points when x is 8 and 33.Q4) Use y = 3.68x - 3.36 to
Q3) Use y = 3.52x - 4.16 to plot the two points when x is 8 and 33.Q4) Use y = 3.68x - 3.36 to draw the line through the two points when x is 2 and 27.Q7) Use y = 0.275x + 8.125 to plot the two points when x is 25 and 65.Q8) Use y = 0.125x + 25.5 to draw the line through the two points when x is 20 and 60.Q10) Use y = 4.32x + 3.04 to plot the two points when x is 3 and 28.Q15)Use y = - 143.75x + 1631.25 to plot the two points when x is 7 and 11.Q19) Use y = - 0.08x + 7.76 to plot the two points when x is 2 and 27. %3DQ11)Use y = - 0.16x + 6.88 to draw the line through the two points when x is 8 and 33.Please graph all the questions 3,4,7,8,10,15,19,11And answer the question in attachment below
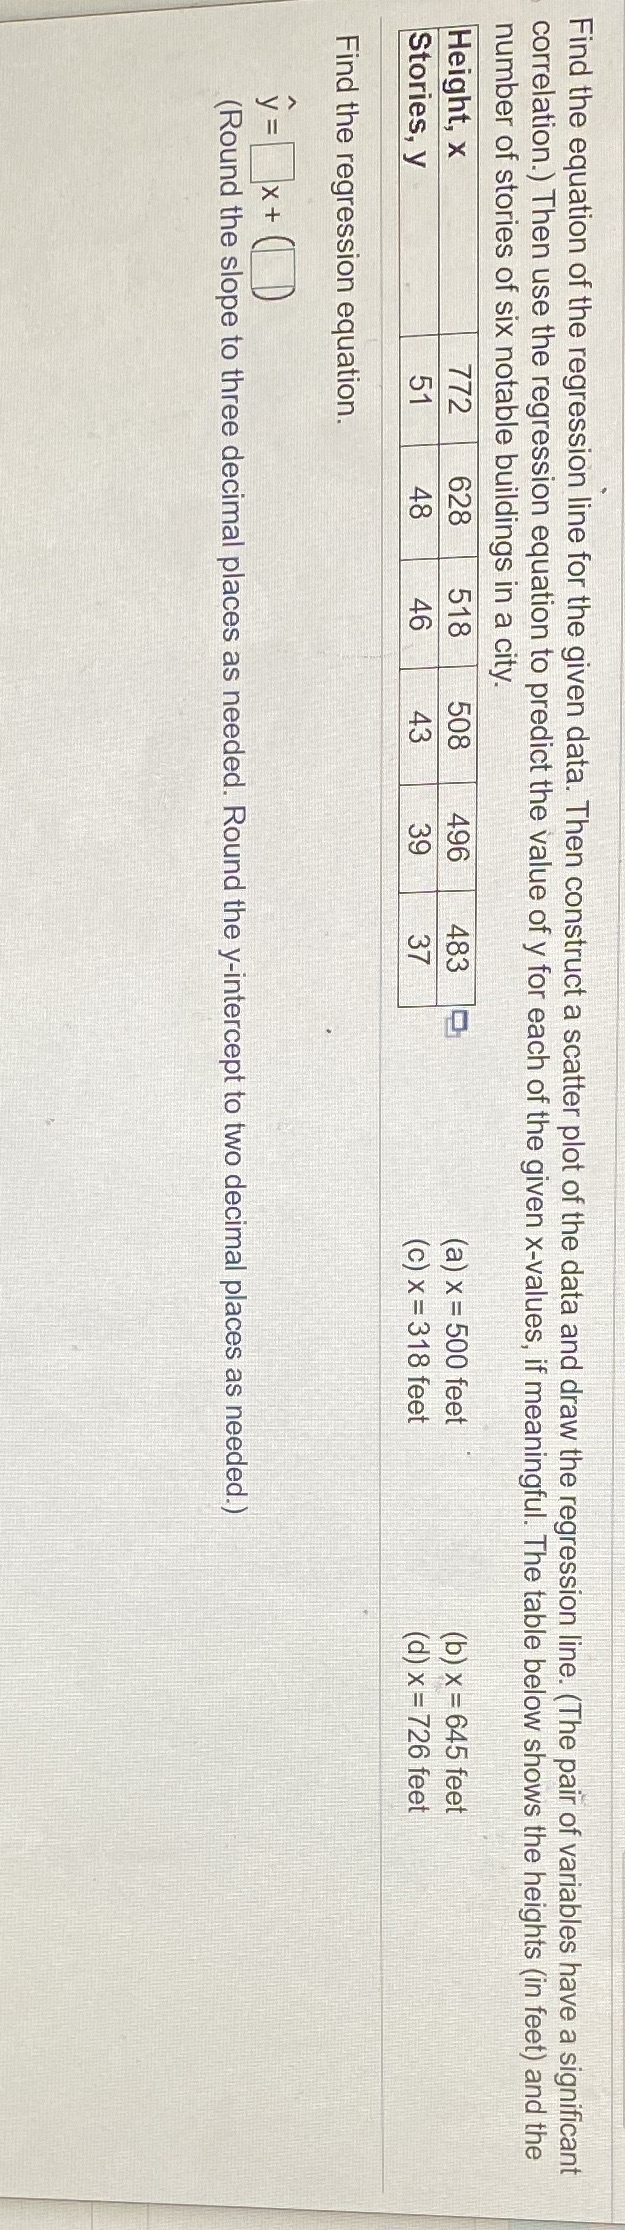
Find the equation of the regression line for the given data. Then construct a scatter plot of the data and draw the regression line. (The pair of variables have a significant correlation.) Then use the regression equation to predict the value of y for each of the given x-values, if meaningful. The table below shows the heights (in feet) and the number of stories of six notable buildings in a city. Height, x 628 518 508 496 483 (a) x = 500 feet (b) x = 645 feet Stories, y (c) x = 318 feet (d) x =726 feet Find the regression equation. y = ]X + (D (Round the slope to three decimal places as needed. Round the y-intercept to two decimal places as needed.)
Step by Step Solution
There are 3 Steps involved in it

Get step-by-step solutions from verified subject matter experts