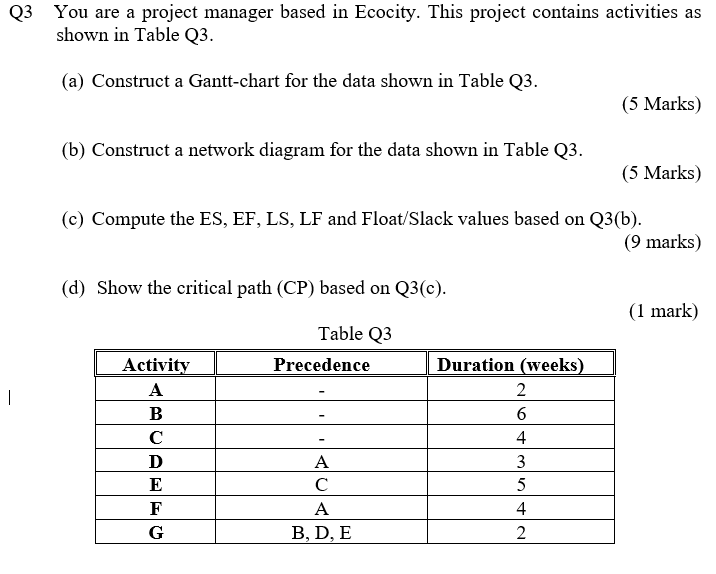
Question: Q3 You are a project manager based in Ecocity. This project contains activities as shown in Table Q3. (a) Construct a Gantt-chart for the data

Q3 You are a project manager based in Ecocity.

Q3 You are a project manager based in Ecocity. This project contains activities as shown in Table Q3. (a) Construct a Gantt-chart for the data shown in Table Q3. (5 Marks) (b) Construct a network diagram for the data shown in Table Q3. (5 Marks) (c) Compute the ES, EF, LS, LF and Float/Slack values based on Q3(b). (9 marks) (d) Show the critical path (CP) based on Q3(c). (1 mark) Table Q3 Precedence - Activity A B D E F G Duration (weeks) 2 6 4 3 5 4 2 A C A B, D, E

Step by Step Solution

There are 3 Steps involved in it

1 Expert Approved Answer
Step: 1 Unlock blur-text-image
Question Has Been Solved by an Expert!

Get step-by-step solutions from verified subject matter experts

Step: 2 Unlock
Step: 3 Unlock

Students Have Also Explored These Related General Management Questions!