

Question: Q4. (25 points) The 40 week demand data for a product is given below. Replenishment cycle is weekly and lead time is 3 days. Week
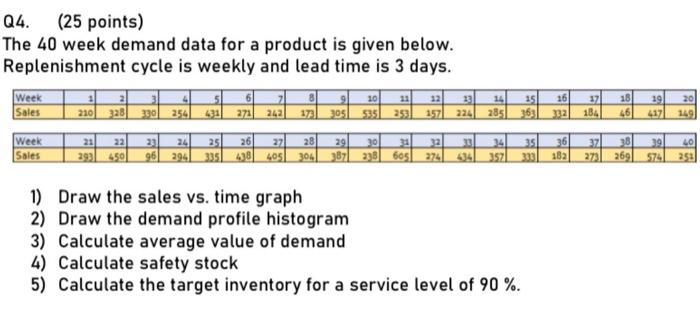
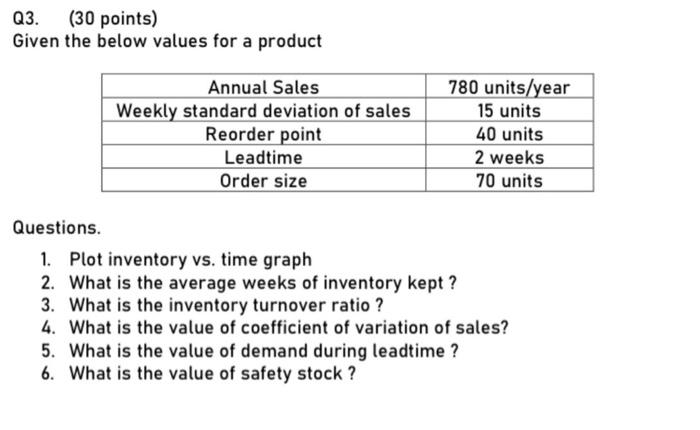
Q4. (25 points) The 40 week demand data for a product is given below. Replenishment cycle is weekly and lead time is 3 days. Week Sales 220 328 330 354 431 271 242 173305 Week 33 24 25 26 27 28 29 Sales 293) 450 96 294 335 438 405 304 387 338 605 274 8 12 23 14 35 10 5351 324 16 3221 17 184 18 46 251 2851 19 4171 1491 21. 22 32 35 33 634 34 3571 36 182 303) 371 273 38 269) 39 574 40 353 1) Draw the sales vs. time graph 2) Draw the demand profile histogram 3) Calculate average value of demand 4) Calculate safety stock 5) Calculate the target inventory for a service level of 90 %. Q3. (30 points) Given the below values for a product Annual Sales Weekly standard deviation of sales Reorder point Leadtime Order size 780 units/year 15 units 40 units 2 weeks 70 units Questions. 1. Plot inventory vs. time graph 2. What is the average weeks of inventory kept? 3. What is the inventory turnover ratio ? 4. What is the value of coefficient of variation of sales? 5. What is the value of demand during leadtime? 6. What is the value of safety stock
Step by Step Solution
There are 3 Steps involved in it

Get step-by-step solutions from verified subject matter experts