

Question: Q4. (5 marks) The quadratic function defined in Q3 can be used to describe some population dynamics in some cases. This usually takes the form

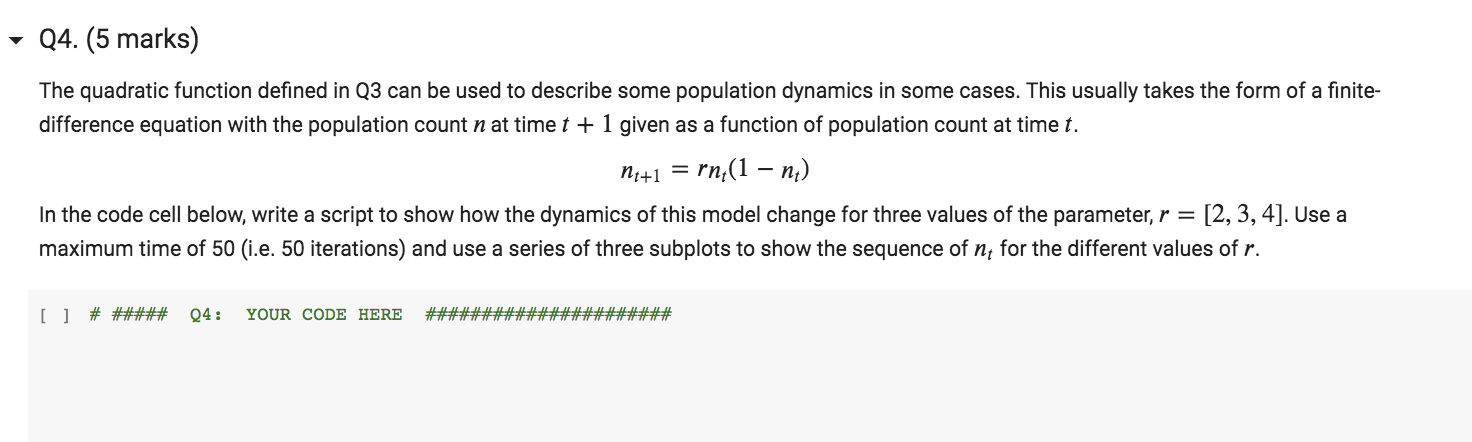
Q4. (5 marks) The quadratic function defined in Q3 can be used to describe some population dynamics in some cases. This usually takes the form of a finite- difference equation with the population count n at time t + 1 given as a function of population count at time t. N7+1 = rn;(1 - nd) In the code cell below, write a script to show how the dynamics of this model change for three values of the parameter, r = [2, 3, 4]. Use a maximum time of 50 (i.e. 50 iterations and use a series of three subplots to show the sequence of n, for the different values of r. [ ] # ##### 94: YOUR CODE HERE ###################### Q4. (5 marks) The quadratic function defined in Q3 can be used to describe some population dynamics in some cases. This usually takes the form of a finite- difference equation with the population count n at time t + 1 given as a function of population count at time t. N7+1 = rn;(1 - nd) In the code cell below, write a script to show how the dynamics of this model change for three values of the parameter, r = [2, 3, 4]. Use a maximum time of 50 (i.e. 50 iterations and use a series of three subplots to show the sequence of n, for the different values of r. [ ] # ##### 94: YOUR CODE HERE ###################### Q4. (5 marks) The quadratic function defined in Q3 can be used to describe some population dynamics in some cases. This usually takes the form of a finite- difference equation with the population count n at time t + 1 given as a function of population count at time t. N7+1 = rn;(1 - nd) In the code cell below, write a script to show how the dynamics of this model change for three values of the parameter, r = [2, 3, 4]. Use a maximum time of 50 (i.e. 50 iterations and use a series of three subplots to show the sequence of n, for the different values of r. [ ] # ##### 94: YOUR CODE HERE ###################### Q4. (5 marks) The quadratic function defined in Q3 can be used to describe some population dynamics in some cases. This usually takes the form of a finite- difference equation with the population count n at time t + 1 given as a function of population count at time t. N7+1 = rn;(1 - nd) In the code cell below, write a script to show how the dynamics of this model change for three values of the parameter, r = [2, 3, 4]. Use a maximum time of 50 (i.e. 50 iterations and use a series of three subplots to show the sequence of n, for the different values of r. [ ] # ##### 94: YOUR CODE HERE ######################
Step by Step Solution
There are 3 Steps involved in it

Get step-by-step solutions from verified subject matter experts