

Question: Q4 please, use 3 as a reference 4. Calculate CPI, SPI, CV, SV, ETC, EAC, and % budget overrun and underrun at the end of
Q4 please, use 3 as a reference
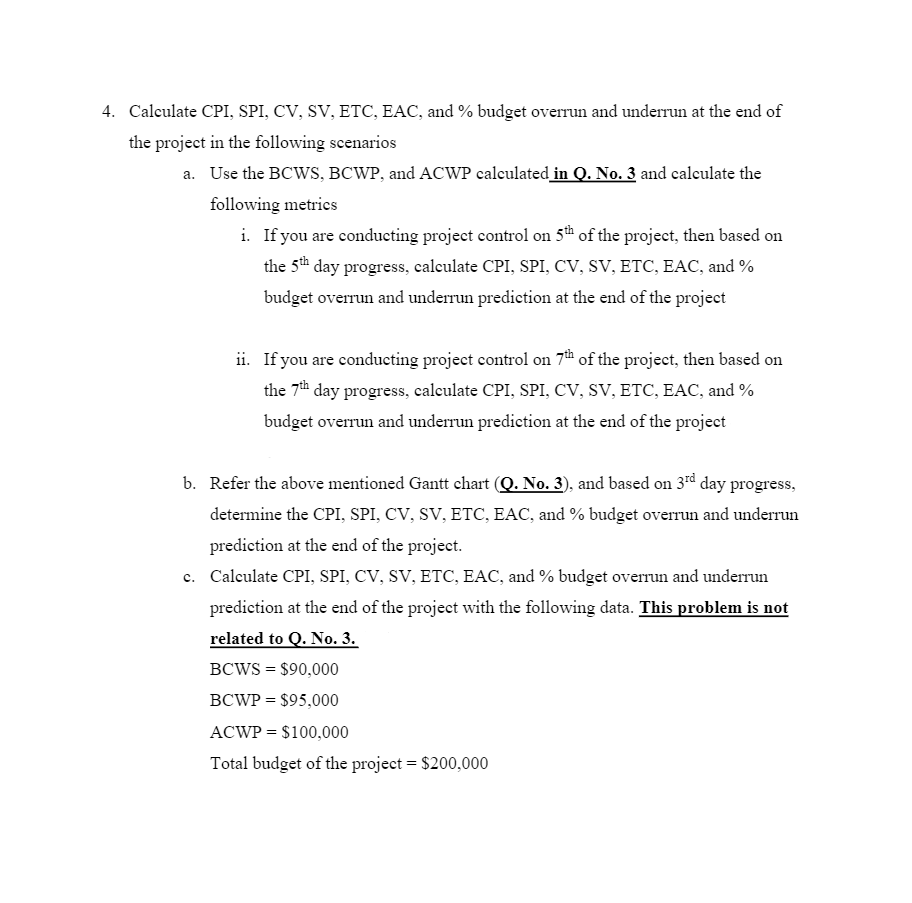
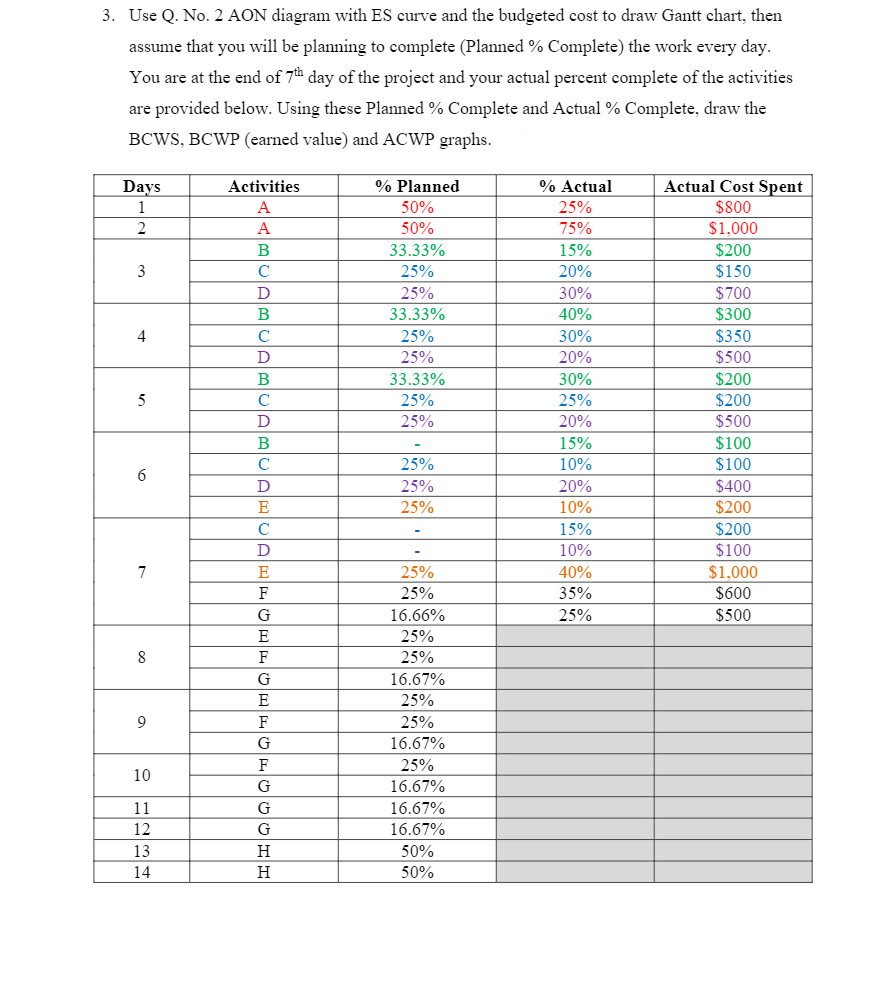
4. Calculate CPI, SPI, CV, SV, ETC, EAC, and % budget overrun and underrun at the end of the project in the following scenarios a. Use the BCWS, BCWP, and ACWP calculated in Q. No. 3 and calculate the following metrics i. If you are conducting project control on 5th of the project, then based on the 5th day progress, calculate CPI, SPI, CV, SV, ETC, EAC, and % budget overrun and underrun prediction at the end of the project ii. If you are conducting project control on 7th of the project, then based on the 7th day progress, calculate CPI, SPI, CV, SV, ETC, EAC, and % budget overrun and underrun prediction at the end of the project b. Refer the above mentioned Gantt chart Q. No. 3), and based on 3rd day progress, determine the CPI, SPI, CV, SV, ETC, EAC, and % budget overrun and underrun prediction at the end of the project. c. Calculate CPI, SPI, CV, SV, ETC, EAC, and % budget overrun and underrun prediction at the end of the project with the following data. This problem is not related to Q. No. 3. BCWS = $90,000 BCWP = $95,000 ACWP = $100,000 Total budget of the project = $200,000 3. Use Q. No. 2 AON diagram with ES curve and the budgeted cost to draw Gantt chart, then assume that you will be planning to complete (Planned % Complete) the work every day. You are at the end of 7th day of the project and your actual percent complete of the activities are provided below. Using these Planned % Complete and Actual % Complete, draw the BCWS, BCWP (earned value) and ACWP graphs. Days 1 2 Activities A A B % Planned 50% 50% 33.33% 25% 25% 33.33% 25% 25% 33.33% Actual Cost Spent $800 $1,000 $200 $150 $700 $300 3 D B 4 C $350 D B 5 C 25% % Actual 25% 75% 15% 20% 30% 40% 30% 20% 30% 25% 20% 15% 10% 20% 10% 15% 10% 40% 35% 25% D 25% B C 6 D F 25% 25% 25% $500 $200 $200 $500 $100 $100 $400 $200 $200 $100 $1,000 $600 $500 C D 7 E 25% F G E 8 F G E 9 F G 25% 16.66% 25% 25% 16.67% 25% 25% 16.67% 25% 16.67% 16.67% 16.67% 50% 50% 10 F G G 11 12 13 14 G H H 4. Calculate CPI, SPI, CV, SV, ETC, EAC, and % budget overrun and underrun at the end of the project in the following scenarios a. Use the BCWS, BCWP, and ACWP calculated in Q. No. 3 and calculate the following metrics i. If you are conducting project control on 5th of the project, then based on the 5th day progress, calculate CPI, SPI, CV, SV, ETC, EAC, and % budget overrun and underrun prediction at the end of the project ii. If you are conducting project control on 7th of the project, then based on the 7th day progress, calculate CPI, SPI, CV, SV, ETC, EAC, and % budget overrun and underrun prediction at the end of the project b. Refer the above mentioned Gantt chart Q. No. 3), and based on 3rd day progress, determine the CPI, SPI, CV, SV, ETC, EAC, and % budget overrun and underrun prediction at the end of the project. c. Calculate CPI, SPI, CV, SV, ETC, EAC, and % budget overrun and underrun prediction at the end of the project with the following data. This problem is not related to Q. No. 3. BCWS = $90,000 BCWP = $95,000 ACWP = $100,000 Total budget of the project = $200,000 3. Use Q. No. 2 AON diagram with ES curve and the budgeted cost to draw Gantt chart, then assume that you will be planning to complete (Planned % Complete) the work every day. You are at the end of 7th day of the project and your actual percent complete of the activities are provided below. Using these Planned % Complete and Actual % Complete, draw the BCWS, BCWP (earned value) and ACWP graphs. Days 1 2 Activities A A B % Planned 50% 50% 33.33% 25% 25% 33.33% 25% 25% 33.33% Actual Cost Spent $800 $1,000 $200 $150 $700 $300 3 D B 4 C $350 D B 5 C 25% % Actual 25% 75% 15% 20% 30% 40% 30% 20% 30% 25% 20% 15% 10% 20% 10% 15% 10% 40% 35% 25% D 25% B C 6 D F 25% 25% 25% $500 $200 $200 $500 $100 $100 $400 $200 $200 $100 $1,000 $600 $500 C D 7 E 25% F G E 8 F G E 9 F G 25% 16.66% 25% 25% 16.67% 25% 25% 16.67% 25% 16.67% 16.67% 16.67% 50% 50% 10 F G G 11 12 13 14 G H H
Step by Step Solution
There are 3 Steps involved in it

Get step-by-step solutions from verified subject matter experts