

Question: Q4. Use the box plot below that represents cholesterol levels in adults to answer the following: What percentage of adults have cholesterol levels of at
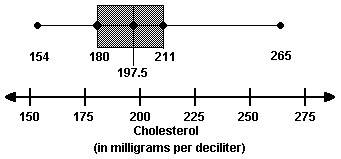
Q4. Use the box plot below that represents cholesterol levels in adults to answer the following:
- What percentage of adults have cholesterol levels of at most 211? Why?
- Is this distribution skewed? Explain and Show the shape of the distribution.
\f
Step by Step Solution
There are 3 Steps involved in it
1 Expert Approved Answer
Step: 1 Unlock

Question Has Been Solved by an Expert!
Get step-by-step solutions from verified subject matter experts
Step: 2 Unlock
Step: 3 Unlock