

Question: Q4) When the basic tool of country risk analysis are applied to the different countries being analyzed, which country is more likely to have what
Q4) When the basic tool of country risk analysis are applied to the different countries being analyzed, which country is more likely to have what kind of crisis, and why?
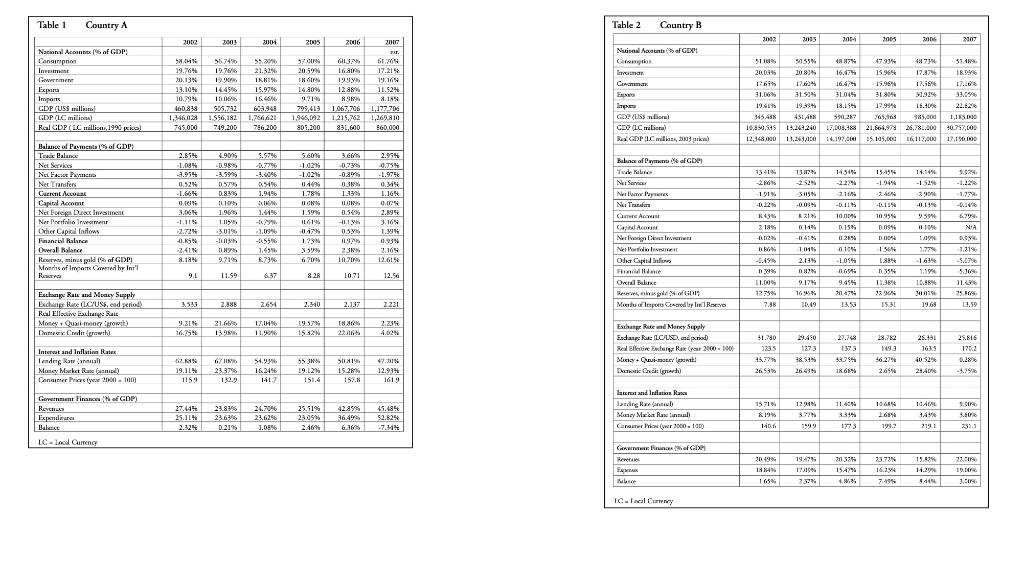
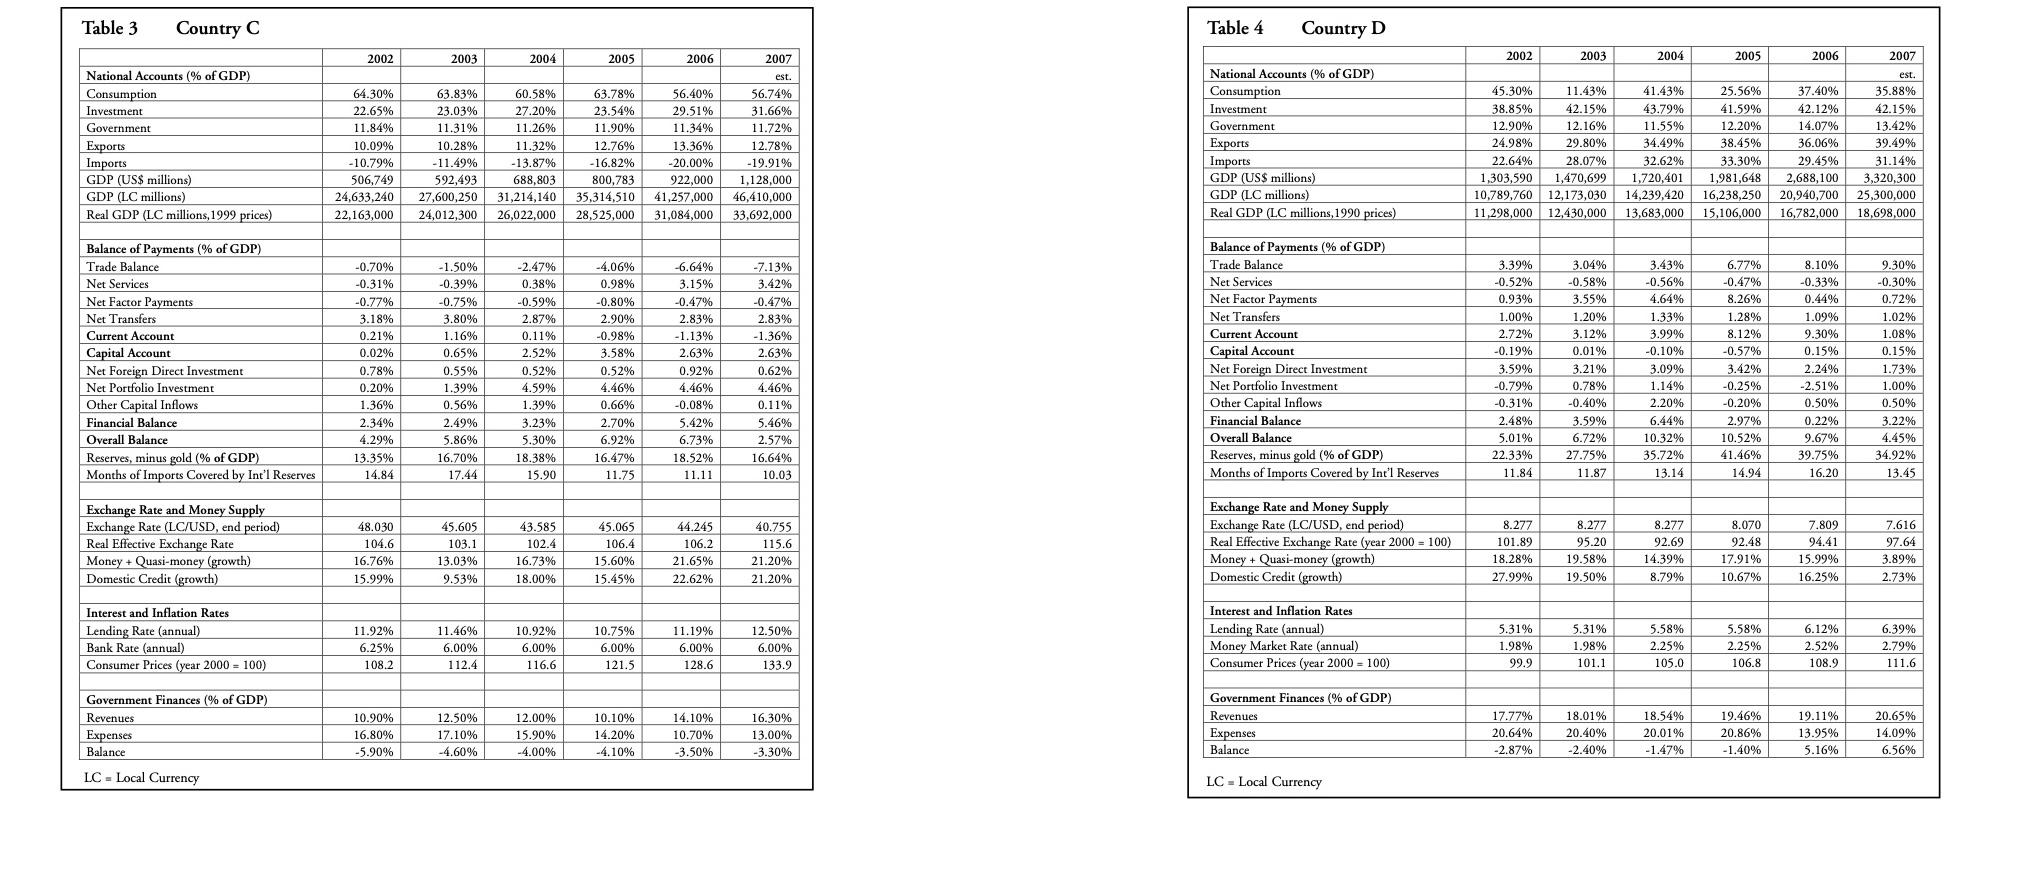
Table 1 Country A Table 2 Country B MORE 2001 005 100 RE 14.30% 12.08% 604.948 795,419 1967,700 10 1968 1766.621 1962 1,215,78 DES for con la Bad GDPC millia, os prin Robins af rymm. * GB Yukle Netfans l'apeur Games Account 10.00 1099895 PHOTO EUR Oxual Blue Seel ME 9.UN 21.60217.071937 1.2.29 A 36 19.1.2018 15.20 WAEST E WEB Table 3 Country C Table 4 Country D 2002 2003 2004 2005 2006 2002 2003 2004 2005 2006 2007 64.30% 22.65% 11.84% National Accounts (% of GDP) Consumption Investment Government Exports Imports GDP (US$ millions) GDP (LC millions) Real GDP (LC millions, 1999 prices) 63.83% 23.03% 11.31% 10.28% -11.49% 592,493 27,600,250 24,012,300 10.09% -10.79% 506,749 24,633,240 22,163,000 60.58% 27.20% 11.26% 11.32% -13.87% 688,803 31,214,140 26.022.000 63.78% 23.54% 11.90% 12.76% -16.82% 800,783 35,314,510 28,525,000 2007 est. 56.74% 31.66% 11.72% 12.78% -19.91% 1,128,000 46,410,000 33,692,000 56.40% 29.51% 11.34% 13.36% -20.00% 922,000 41,257,000 31,084,000 National Accounts (% of GDP) Consumption Investment Government Exports Imports GDP (US$ millions) GDP (LC millions) Real GDP (LC millions, 1990 prices) 45.30% 11.43% 38.85% 42.15% 12.90% 12.16% 24.98% 29.80% 22.64% 28.07% 1,303,590 1,470,699 10,789,760 12,173,030 11,298,000 12,430,000 41.43% 43.79% 11.55% 34.49% 32.62% 1,720,401 14,239,420 13,683,000 25.56% 41.59% 12.20% 38.45% 33.30% 1,981,648 16,238,250 15,106,000 37.40% 42.12% 14.07% 36.06% 29.45% 2,688,100 20,940,700 16,782,000 est. 35.88% 42.15% 13.42% 39.49% 31.14% 3,320,300 25,300,000 18,698,000 Balance of Payments (% of GDP) Trade Balance Net Services Net Factor Payments Net Transfers Current Account Capital Account Net Foreign Direct Investment Net Portfolio Investment Other Capital Inflows Financial Balance Overall Balance Reserves, minus gold (% of GDP) Months of Imports Covered by Int'l Reserves -0.70% -0.31% -0.77% 3.18% 0.21% 0.02% 0.78% 0.20% 1.36% 2.34% 4.29% 13.35% 14.84 9.30% -0.30% 0.72% 1.02% 1.08% 0.15% -1.50% -0.39% -0.75% 3.80% 1.16% 0.65% 0.55% 1.39% 0.56% 2.49% 5.86% 16.70% 17.44 -2.47% 0.38% -0.59% 2.87% 0.11% 2.52% 0.52% 4.59% 1.39% 3.23% -4.06% 0.98% -0.809 2.90% -0.98% 3.58% 0.52% 4.46% 0.66% 2.70% 6.92% 16.47% 11.75 -6.64% 3.15% -0.47% 2.83% -1.13% 2.63% 0.929 4.46% -0.08% 5.42% 6.73% 18.52% 11.11 -7.13% 3.42% -0.47% 2.83% -1.36% 2.63% 0.62% 4.46% 0.11% 5.46% 2.57% 16.64% 10.03 Balance of Payments (% of GDP) Trade Balance Net Services Net Factor Payments Net Transfers Current Account Capital Account Net Foreign Direct Investment Net Portfolio Investment Other Capital Inflows Financial Balance Overall Balance Reserves, minus gold (% of GDP) Months of Imports Covered by Int'l Reserves 3.39% -0.52% 0.93% 1.00% 2.72% -0.19% 3.59% -0.79% -0.31% 2.48% 5.01% 22.33% 11.84 3.04% -0.58% 3.55% 1.20% 3.12% 0.01% 3.21% 0.78% -0.40% 3.59% 6.72% 27.75% 11.87 3.43% -0.56% 4.64% 1.33% 3.99% -0.10% 3.09% 1.14% 2.20% 6.44% 10.32% 35.72% 13.14 6.77% -0.47% 8.26% 1.28% 8.12% -0.57% 3.42% -0.25% -0.20% 2.97% 8.10% -0.33% 0.44% 1.09% 9.30% 0.15% 2.24% -2.51% 0.50% 0.22% 9.67% 39.75% 16,20 1.73% 1.00% 0.50% 3.22% 4.45% 34.92% 13.45 5.30% 10.52% 18.38% 15.90 41.46% 14.94 Exchange Rate and Money Supply Exchange Rate (LC/USD, end period) Real Effective Exchange Rate Money + Quasi-money (growth) Domestic Credit (growth) 48.030 104.6 16.76% 45.605 103.1 13.03% 9.53% 43.585 102.4 16.73% 18.00% 45.065 106.4 15.60% 15.45% 44.245 106.2 21.65% 22.62% 40.755 115.6 21.20% 21.20% Exchange Rate and Money Supply Exchange Rate (LC/USD, end period) Real Effective Exchange Rate (year 2000 = 100) Money + Quasi-money (growth) Domestic Credit (growth) 8.277 101.89 18.28% 27.99% 8.277 95.20 19.58% 19.50% 8.277 92.69 14.39% 8.79% 8.070 92.48 17.91% 10.67% 7.809 94.41 15.99% 16.25% 7.616 97.64 3.89% 2.73% 15.99% Interest and Inflation Rates Lending Rate (annual) Bank Rate (annual) Consumer Prices (year 2000 = 100) 11.92% 6.25% 108.2 11.46% 6.00% 112.4 10.92% 6.00% 116.6 10.75% 6.00% 121.5 11.19% 6.00% 128.6 12.50% 6.00% 133.9 Interest and Inflation Rates Lending Rate (annual) Money Market Rate (annual) Consumer Prices (year 2000 = 100) 5.31% 1.98% 99.9 5.31% 1.98% 101.1 5.58% 2.25% 105.0 5.58% 2.25% 106.8 6.12% 2.52% 108.9 6.39% 2.79% 111.6 Government Finances (% of GDP) Revenues Expenses Balance 10.90% 16.80% -5.90% 12.50% 17.10% -4.60% 12.00% 15.90% -4.00% 10.10% 14.20% -4.10% 14.10% 10.70% -3.50% 16.30% 13.00% -3.30% Government Finances (% of GDP) Revenues Expenses Balance 17.77% 20.64% -2.87% 18.01% 20.40% -2.40% 18.54% 20.01% 19.46% 20.86% -1.40% 19.11% 13.95% 5.16% 20.65% 14.09% 6.56% -1.47% LC - Local Currency LC - Local Currency Table 1 Country A Table 2 Country B MORE 2001 005 100 RE 14.30% 12.08% 604.948 795,419 1967,700 10 1968 1766.621 1962 1,215,78 DES for con la Bad GDPC millia, os prin Robins af rymm. * GB Yukle Netfans l'apeur Games Account 10.00 1099895 PHOTO EUR Oxual Blue Seel ME 9.UN 21.60217.071937 1.2.29 A 36 19.1.2018 15.20 WAEST E WEB Table 3 Country C Table 4 Country D 2002 2003 2004 2005 2006 2002 2003 2004 2005 2006 2007 64.30% 22.65% 11.84% National Accounts (% of GDP) Consumption Investment Government Exports Imports GDP (US$ millions) GDP (LC millions) Real GDP (LC millions, 1999 prices) 63.83% 23.03% 11.31% 10.28% -11.49% 592,493 27,600,250 24,012,300 10.09% -10.79% 506,749 24,633,240 22,163,000 60.58% 27.20% 11.26% 11.32% -13.87% 688,803 31,214,140 26.022.000 63.78% 23.54% 11.90% 12.76% -16.82% 800,783 35,314,510 28,525,000 2007 est. 56.74% 31.66% 11.72% 12.78% -19.91% 1,128,000 46,410,000 33,692,000 56.40% 29.51% 11.34% 13.36% -20.00% 922,000 41,257,000 31,084,000 National Accounts (% of GDP) Consumption Investment Government Exports Imports GDP (US$ millions) GDP (LC millions) Real GDP (LC millions, 1990 prices) 45.30% 11.43% 38.85% 42.15% 12.90% 12.16% 24.98% 29.80% 22.64% 28.07% 1,303,590 1,470,699 10,789,760 12,173,030 11,298,000 12,430,000 41.43% 43.79% 11.55% 34.49% 32.62% 1,720,401 14,239,420 13,683,000 25.56% 41.59% 12.20% 38.45% 33.30% 1,981,648 16,238,250 15,106,000 37.40% 42.12% 14.07% 36.06% 29.45% 2,688,100 20,940,700 16,782,000 est. 35.88% 42.15% 13.42% 39.49% 31.14% 3,320,300 25,300,000 18,698,000 Balance of Payments (% of GDP) Trade Balance Net Services Net Factor Payments Net Transfers Current Account Capital Account Net Foreign Direct Investment Net Portfolio Investment Other Capital Inflows Financial Balance Overall Balance Reserves, minus gold (% of GDP) Months of Imports Covered by Int'l Reserves -0.70% -0.31% -0.77% 3.18% 0.21% 0.02% 0.78% 0.20% 1.36% 2.34% 4.29% 13.35% 14.84 9.30% -0.30% 0.72% 1.02% 1.08% 0.15% -1.50% -0.39% -0.75% 3.80% 1.16% 0.65% 0.55% 1.39% 0.56% 2.49% 5.86% 16.70% 17.44 -2.47% 0.38% -0.59% 2.87% 0.11% 2.52% 0.52% 4.59% 1.39% 3.23% -4.06% 0.98% -0.809 2.90% -0.98% 3.58% 0.52% 4.46% 0.66% 2.70% 6.92% 16.47% 11.75 -6.64% 3.15% -0.47% 2.83% -1.13% 2.63% 0.929 4.46% -0.08% 5.42% 6.73% 18.52% 11.11 -7.13% 3.42% -0.47% 2.83% -1.36% 2.63% 0.62% 4.46% 0.11% 5.46% 2.57% 16.64% 10.03 Balance of Payments (% of GDP) Trade Balance Net Services Net Factor Payments Net Transfers Current Account Capital Account Net Foreign Direct Investment Net Portfolio Investment Other Capital Inflows Financial Balance Overall Balance Reserves, minus gold (% of GDP) Months of Imports Covered by Int'l Reserves 3.39% -0.52% 0.93% 1.00% 2.72% -0.19% 3.59% -0.79% -0.31% 2.48% 5.01% 22.33% 11.84 3.04% -0.58% 3.55% 1.20% 3.12% 0.01% 3.21% 0.78% -0.40% 3.59% 6.72% 27.75% 11.87 3.43% -0.56% 4.64% 1.33% 3.99% -0.10% 3.09% 1.14% 2.20% 6.44% 10.32% 35.72% 13.14 6.77% -0.47% 8.26% 1.28% 8.12% -0.57% 3.42% -0.25% -0.20% 2.97% 8.10% -0.33% 0.44% 1.09% 9.30% 0.15% 2.24% -2.51% 0.50% 0.22% 9.67% 39.75% 16,20 1.73% 1.00% 0.50% 3.22% 4.45% 34.92% 13.45 5.30% 10.52% 18.38% 15.90 41.46% 14.94 Exchange Rate and Money Supply Exchange Rate (LC/USD, end period) Real Effective Exchange Rate Money + Quasi-money (growth) Domestic Credit (growth) 48.030 104.6 16.76% 45.605 103.1 13.03% 9.53% 43.585 102.4 16.73% 18.00% 45.065 106.4 15.60% 15.45% 44.245 106.2 21.65% 22.62% 40.755 115.6 21.20% 21.20% Exchange Rate and Money Supply Exchange Rate (LC/USD, end period) Real Effective Exchange Rate (year 2000 = 100) Money + Quasi-money (growth) Domestic Credit (growth) 8.277 101.89 18.28% 27.99% 8.277 95.20 19.58% 19.50% 8.277 92.69 14.39% 8.79% 8.070 92.48 17.91% 10.67% 7.809 94.41 15.99% 16.25% 7.616 97.64 3.89% 2.73% 15.99% Interest and Inflation Rates Lending Rate (annual) Bank Rate (annual) Consumer Prices (year 2000 = 100) 11.92% 6.25% 108.2 11.46% 6.00% 112.4 10.92% 6.00% 116.6 10.75% 6.00% 121.5 11.19% 6.00% 128.6 12.50% 6.00% 133.9 Interest and Inflation Rates Lending Rate (annual) Money Market Rate (annual) Consumer Prices (year 2000 = 100) 5.31% 1.98% 99.9 5.31% 1.98% 101.1 5.58% 2.25% 105.0 5.58% 2.25% 106.8 6.12% 2.52% 108.9 6.39% 2.79% 111.6 Government Finances (% of GDP) Revenues Expenses Balance 10.90% 16.80% -5.90% 12.50% 17.10% -4.60% 12.00% 15.90% -4.00% 10.10% 14.20% -4.10% 14.10% 10.70% -3.50% 16.30% 13.00% -3.30% Government Finances (% of GDP) Revenues Expenses Balance 17.77% 20.64% -2.87% 18.01% 20.40% -2.40% 18.54% 20.01% 19.46% 20.86% -1.40% 19.11% 13.95% 5.16% 20.65% 14.09% 6.56% -1.47% LC - Local Currency LC - Local Currency
Step by Step Solution
There are 3 Steps involved in it

Get step-by-step solutions from verified subject matter experts