

Question: q4Given a set ofn=64 n=64data: D Question 4 9 Given a set of n = 64 data: 52 58 69 301 310 313 319 321
q4Given a set ofn=64
n=64data:
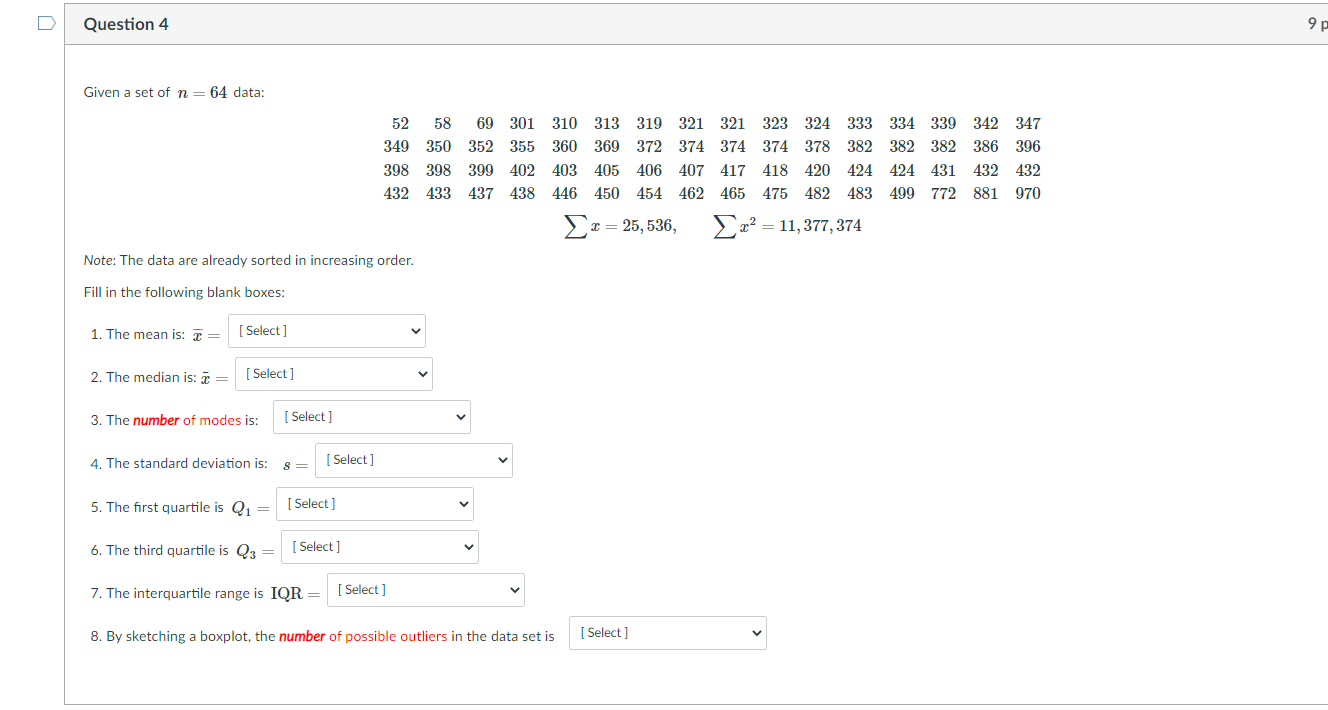
D Question 4 9 Given a set of n = 64 data: 52 58 69 301 310 313 319 321 321 323 324 333 334 339 342 347 349 350 352 355 360 369 372 374 374 374 378 382 382 382 386 396 398 398 399 402 403 405 406 407 417 418 420 424 424 431 432 432 432 433 437 438 446 450 454 462 465 475 482 483 499 772 881 970 Ex = 25, 536, Ex? = 11, 377, 374 Note: The data are already sorted in increasing order. Fill in the following blank boxes: 1. The mean is: x = [ Select ] 2. The median is: x = [ Select ] 3. The number of modes is: [ Select ] 4. The standard deviation is: $ = [ Select ] 5. The first quartile is Q1 = [ Select ] 6. The third quartile is Q3 = [ Select ] 7. The interquartile range is IQR = [ Select ] 8. By sketching a boxplot, the number of possible outliers in the data set is [ Select ]
Step by Step Solution
There are 3 Steps involved in it

Get step-by-step solutions from verified subject matter experts