

Question: Q5. Can you reject the null hypothesis: Null hypothesis for the relationship between fire history (years since fire) and plant species richness- No statistical relationship
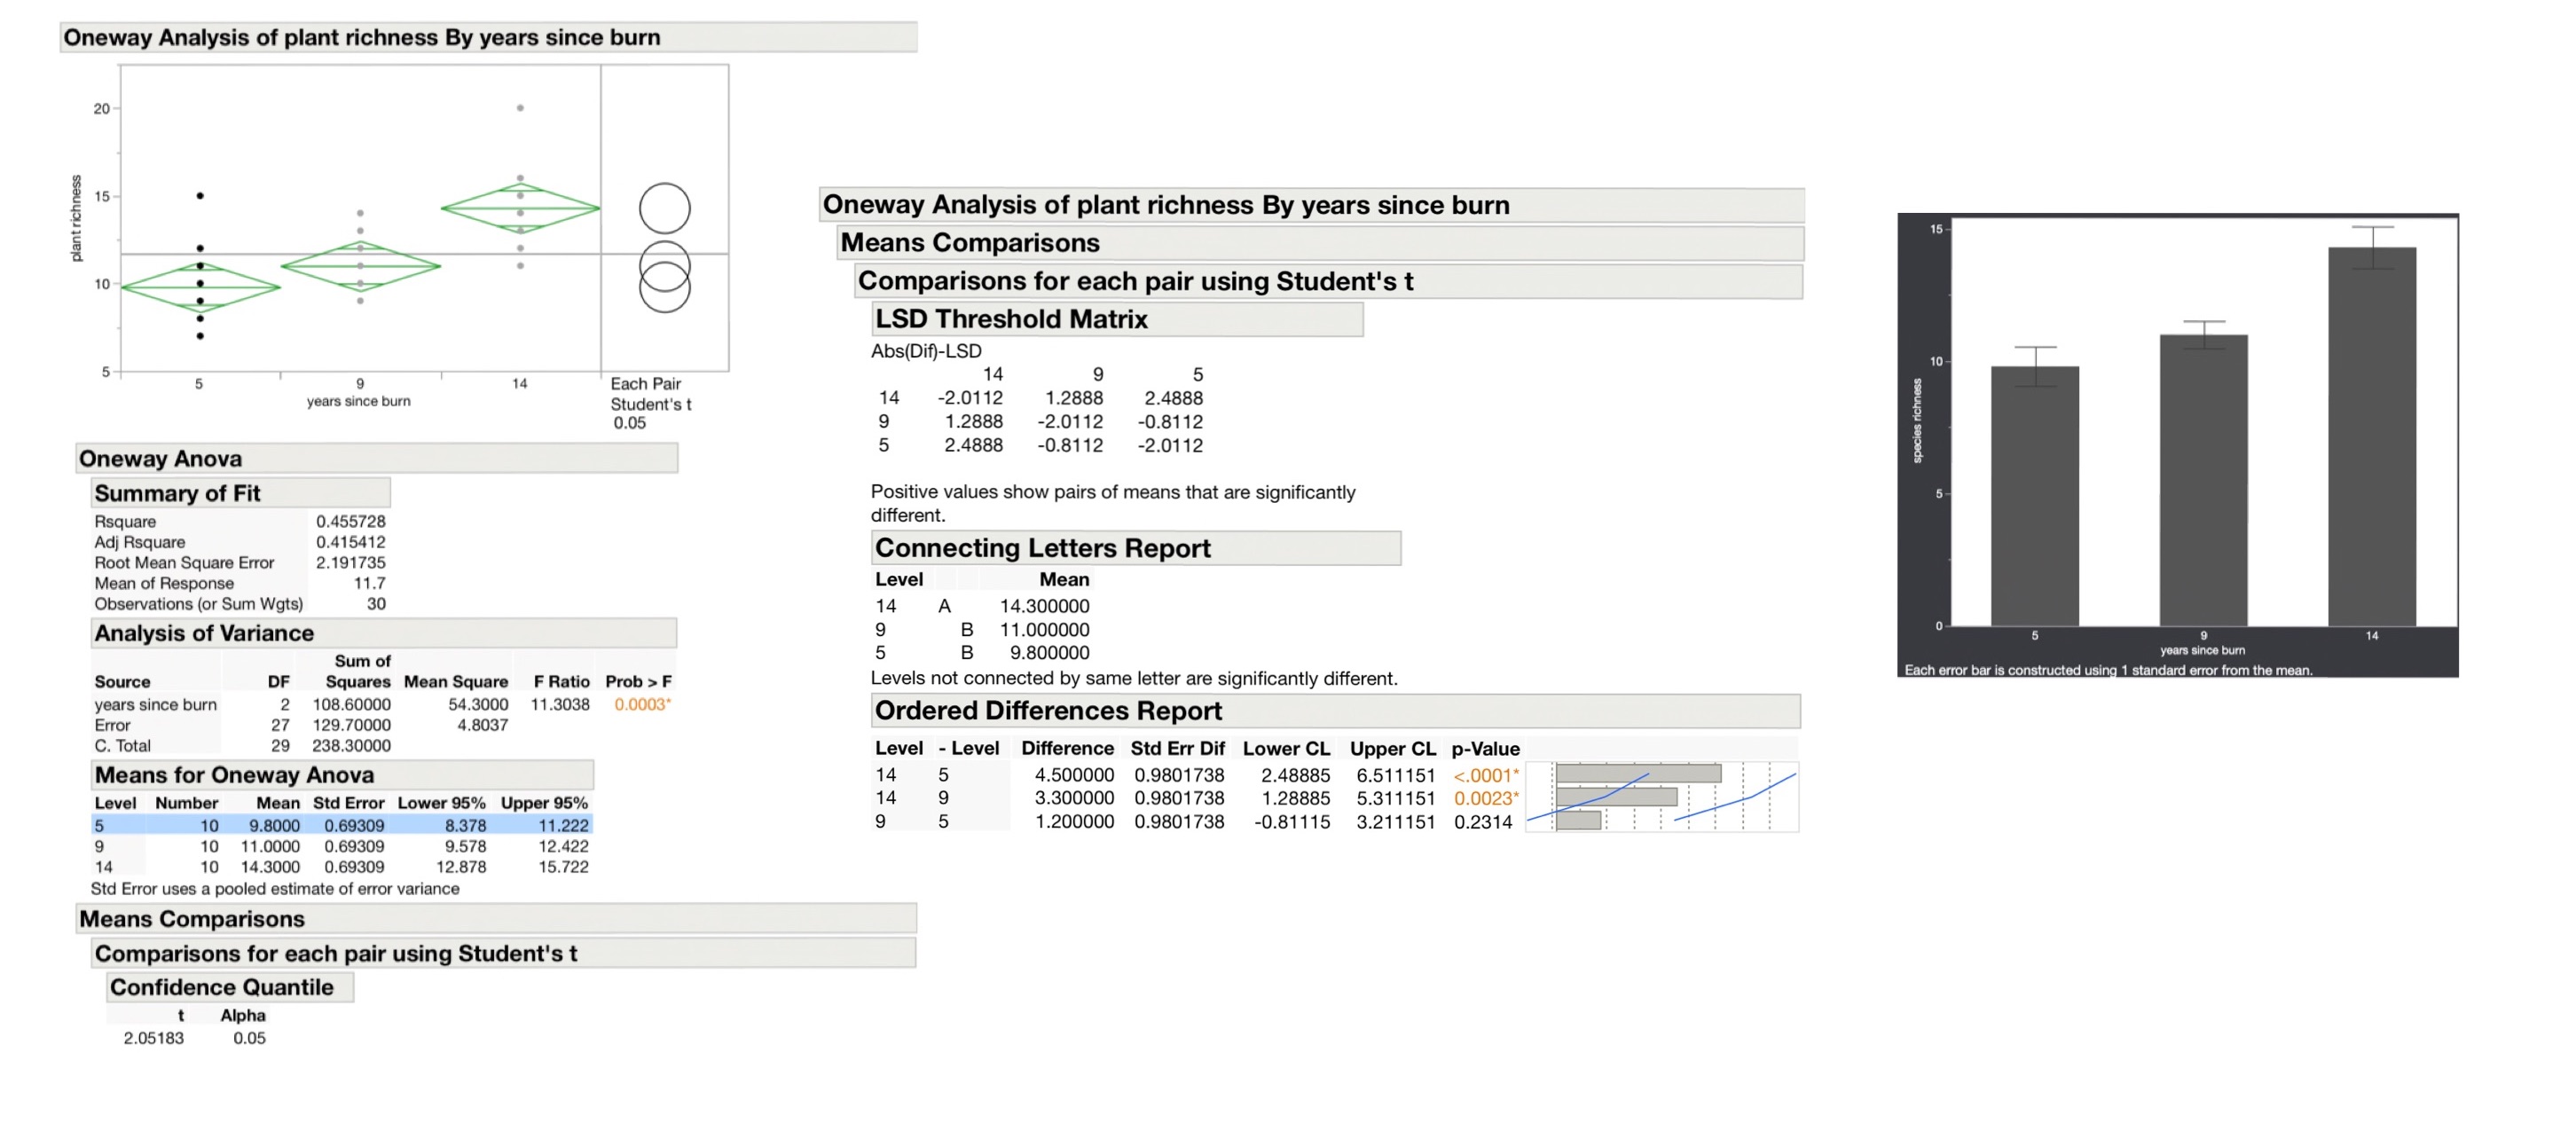
Q5. Can you reject the null hypothesis: Null hypothesis for the relationship between fire history (years since fire) and plant species richness- No statistical relationship between fire history (years since burn) and plant species richnessYes or NoQ6. Write out your statistical result in the formal format of ecological findings: a single, precise sentence telling how time since wildfire affected the response variable, followed by a summary of statistical information in parentheses as follows:Concise sentence describing the relationship supported by the statistical test (F=XX, p=XX).??After performing Post-Hoc TEST (please see attached image)Q7. Describe, in a sentence (or two), which burn years differ significantly in their richness levels and which do not.Q8. What is the p-value associated with the difference in richness between areas burned 14 and 9 years agoQ9 .Does richness increase or decline with time since the last wildfire?

Oneway Analysis of plant richness By years since burn 20 15 Oneway Analysis of plant richness By years since burn plant richness 15 Means Comparisons 10 Comparisons for each pair using Student's t LSD Threshold Matrix Abs(Dif)-LSD 10- 9 14 Each Pair 14 years since burn Student's t 14 -2.0112 1.2888 2.4888 0.05 1.2888 -2.0112 -0.8112 species richness 2.4888 -0.8112 -2.0112 Oneway Anova Summary of Fit Positive values show pairs of means that are significantly Rsquare 0.455728 different Adj Rsquare 0.415412 Connecting Letters Report Root Mean Square Error 2.191735 Mean of Response 11.7 Level Mean Observations (or Sum Wgts) 30 14 A 14.300000 Analysis of Variance 9 B 11.000000 5 B Sum of 9.800000 years since burn Source DF Squares Mean Square F Ratio Prob > F Levels not connected by same letter are significantly different. Each error bar is constructed using 1 standard error from the mean. years since burn 2 108.60000 54.3000 11.3038 0.0003* 27 Ordered Differences Report Error 129.7000 4.8037 C. Total 29 238.30000 Level - Level Difference Std Err Dif Lower CL Upper CL p-Value Means for Oneway Anova 14 4.500000 0.9801738 2.48885 6.511151 <.0001 level number mean std error lower upper uses a pooled estimate of variance means comparisons for each pair using student t confidence quantile alpha>
Step by Step Solution
There are 3 Steps involved in it

Get step-by-step solutions from verified subject matter experts