

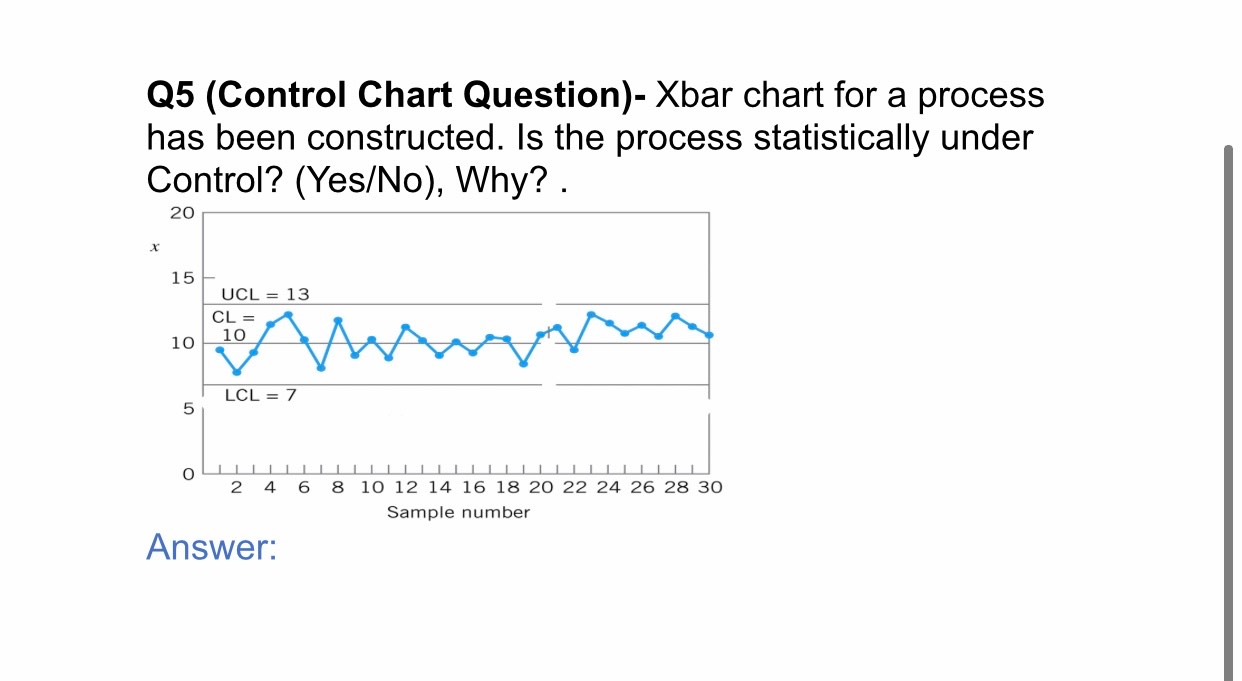
Question: Q5 (Control Chart Question)- Xbar chart for a process has been constructed. Is the process statistically under Control? (Yes/No), Why? . 20 X 15 UCL
Step by Step Solution
There are 3 Steps involved in it
1 Expert Approved Answer
Step: 1 Unlock

Question Has Been Solved by an Expert!
Get step-by-step solutions from verified subject matter experts
Step: 2 Unlock
Step: 3 Unlock