

Question: We studied queueing delay, the graph in the slide shows that as traffic intensity approaches 1, the average queueing delay increases significantly. In other words,
We studied queueing delay, the graph in the slide shows that as traffic intensity approaches 1, the average queueing delay increases significantly. In other words, if the arrival rate is close to the service rate, which is the rate at which packets are transmitted on to the link, queueing delay will build up (think of standing in line at Starbucks during busy hours). Under certain assumptions, average queueing delay (or expected value of waiting time) is given by E[W] = (La/R) (2) - where a is the arrival rate, L is the average packet length, and R is the transmission rate. The ratio R/L is the departure rate. This equation assumes that departure rate is more than arrival rate because otherwise the length of the queue will increase indefinitely.
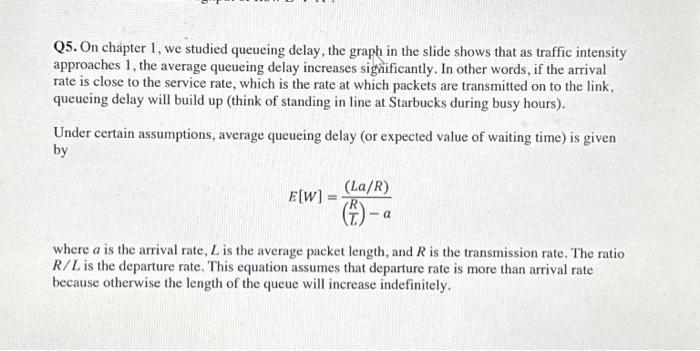
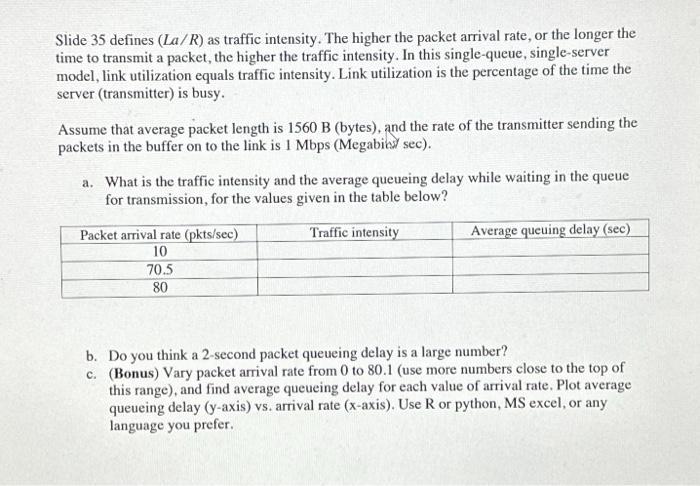
Q5. On chapter 1, we studied queueing delay, the graph in the slide shows that as traffic intensity approaches 1, the average queueing delay increases significantly. In other words, if the arrival rate is close to the service rate, which is the rate at which packets are transmitted on to the link. queueing delay will build up (think of standing in line at Starbucks during busy hours). Under certain assumptions, average queueing delay (or expected value of waiting time) is given by E[W] = = (La/R) (+)- - a where a is the arrival rate, L is the average packet length, and R is the transmission rate. The ratio R/L is the departure rate. This equation assumes that departure rate is more than arrival rate because otherwise the length of the queue will increase indefinitely.
Step by Step Solution
There are 3 Steps involved in it
ANSWER To answer the questions lets first calculate the traffic intensity and average queueing delay based on the given information a Traffic Intensity LaR Arrival Rate a Given as LaR Average Packet L... View full answer

Get step-by-step solutions from verified subject matter experts