

Question: Q5. The message signal m(t), whose frequency spectrum is shown in the following figure. m(t) is the input of the given block diagram where
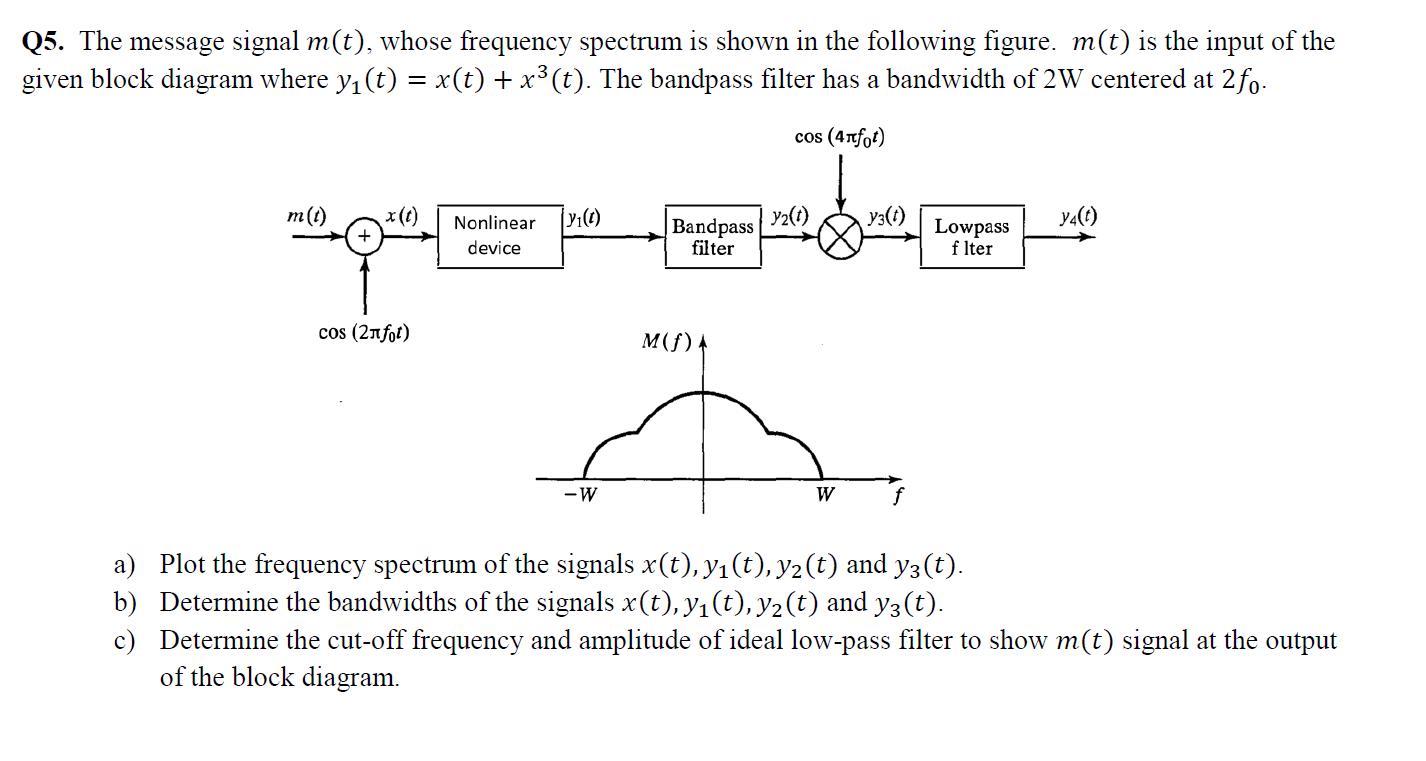
Q5. The message signal m(t), whose frequency spectrum is shown in the following figure. m(t) is the input of the given block diagram where y, (t) = x(t) + x (t). The bandpass filter has a bandwidth of 2W centered at 2fo- cos (4nfot) m(t) x(t) Nonlinear Y2(t) Bandpass filter Lowpass f Iter device cos (2t ) M(f)4 -W W f a) Plot the frequency spectrum of the signals x(t), y1(t), y2(t) and y3(t). b) Determine the bandwidths of the signals x(t), y1(t), y2(t) and y3(t). c) Determine the cut-off frequency and amplitude of ideal low-pass filter to show m(t) signal at the output of the block diagram.
Step by Step Solution
There are 3 Steps involved in it

Get step-by-step solutions from verified subject matter experts