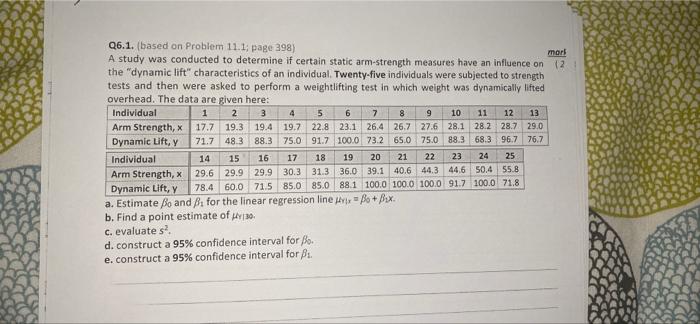
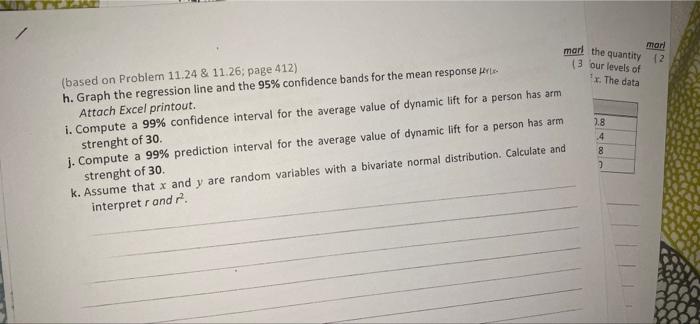
Question: Q6.1. (based on Problem 11.1: page 398) A study was conducted to determine if certain static arm-strength measures have an influence on mark the dynamic

Q6.1. (based on Problem 11.1: page 398) A study
Q6.1. (based on Problem 11.1: page 398) A study was conducted to determine if certain static arm-strength measures have an influence on mark the "dynamic lift" characteristics of an individual. Twenty-five individuals were subjected to strength 12 tests and then were asked to perform a weightlifting test in which weight was dynamically lifted overhead. The data are given here: Individual 1 2 3 4 5 6 7 8 9 10 11 12 13 Arm Strength, x 17.7 19.3 19.4 19.7 22.8 23.1 26.4 26.7 27.6 28.1 28.2 28.7 29.0 Dynamic Lift, y 71.7 48.3 88.3 75.0 91.7 100.0 73.2 65.0 75.0 88.3 68.3 96.7 76.7 Individual 14 15 16 17 18 19 20 21 22 23 24 25 Arm Strength, x 29.6 29.9 29.9 30.3 31.3 36.0 39.1 40.6 44.3 44.6 50.4 55.8 Dynamic Lift, y 78.4 60.0 71.5 85.0 85.0 88.1 100.0 100.0 100.0 91.7 100.0 71.8 a. Estimate o and for the linear regression line w Bo + Box b. Find a point estimate of 30 c. evaluates d. construct a 95% confidence interval for Bo. e, construct a 95% confidence interval for Bs. ased on Problem 11.15, 11.16 & 11.20; page 411) mark 1 f. Test the hypothesis that Bo = 0 against the alternative that Bo +0. Use a 0.05 level of significance. (41 8. Test the hypothesis that B1 = 0 against the alternative that B10 at the 0.05 level of significance and interpret the resulting decision f. 1. 2. 3. 4. mor mark the quantity 12 (3 our levels of . The data (based on Problem 11.24 & 11.26; page 412) h. Graph the regression line and the 95% confidence bands for the mean response pre Attach Excel printout. i. Compute a 99% confidence interval for the average value of dynamic lift for a person has arm strenght of 30. j. Compute a 99% prediction interval for the average value of dynamic lift for a person has arm strenght of 30 k. Assume that x and y are random variables with a bivariate normal distribution. Calculate and interpret r and r? 7.8 .4 8 sed on Problem 11.34 & 11.44; page 422 & 435) mark 1. Use an analysis-of-variance approach to test the hypothesis that Bi = 0 against the alternative (4 hypothesis B1-0 at the 0.05 level of significance. m. Test the hypothesis that p = 0 against the alternative that p0 at the 0.05 level of significance. Comment ing the quant h four levels of x. The dat 0.8 1.4 1. 1. 8 2. 3

Step by Step Solution

There are 3 Steps involved in it

1 Expert Approved Answer
Step: 1 Unlock blur-text-image
Question Has Been Solved by an Expert!

Get step-by-step solutions from verified subject matter experts

Step: 2 Unlock
Step: 3 Unlock

Students Have Also Explored These Related General Management Questions!