

Question: Q7-1 Valuing a Copper Mining Project Using Forward Prices Harrington Explorations Inc. is interested in expanding its copper mining operations in Indonesia. The area has
Q7-1 Valuing a Copper Mining Project Using Forward Prices
Harrington Explorations Inc. is interested in expanding its copper mining operations in Indonesia. The area has long been noted for its rich deposits of copper ore. With copper prices at near-record levels, the company is considering an investment of $60 million to open operations into a new vein of ore that was mapped by company geologists four years ago. The investment would be expensed (a combination of depreciation of capital equipment and depletion costs associated with using up the ore deposit) over five years toward a zero value. Because Harrington faces a corporate tax rate of 30%, the tax savings are significant.
The companys geologists also estimate that the ore will be of about the same purity as existing deposits, meaning that it will cost $150 to mine and process a ton of ore containing roughly 15% pure copper. The company estimates that there are 75,000 tons of ore in the new vein that can be mined and processed over the next five years at a pace of 15,000 tons per year.
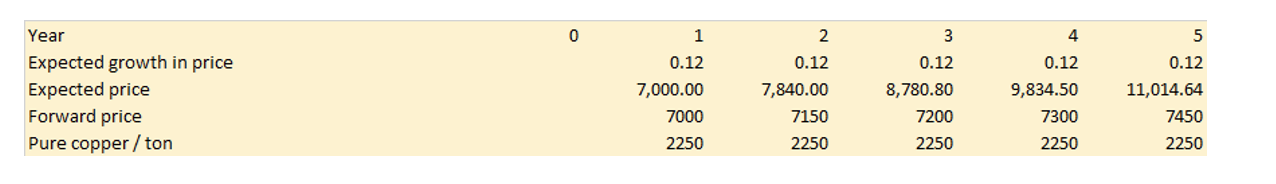
Harringtons CFO asked one of his financial analysts to come up with an estimate of the expected value of the investment using the forward price curve for copper as a guide to the value of future copper production. The forward price curve for the price per ton of copper spanning the next five years when the proposed investment would be in production is as follows:
In a study commissioned by the CFO last year, the firms cost of capital was estimated to be 9.5%. The risk-free rate of interest on five-year Treasury bonds is currently 5.5%.
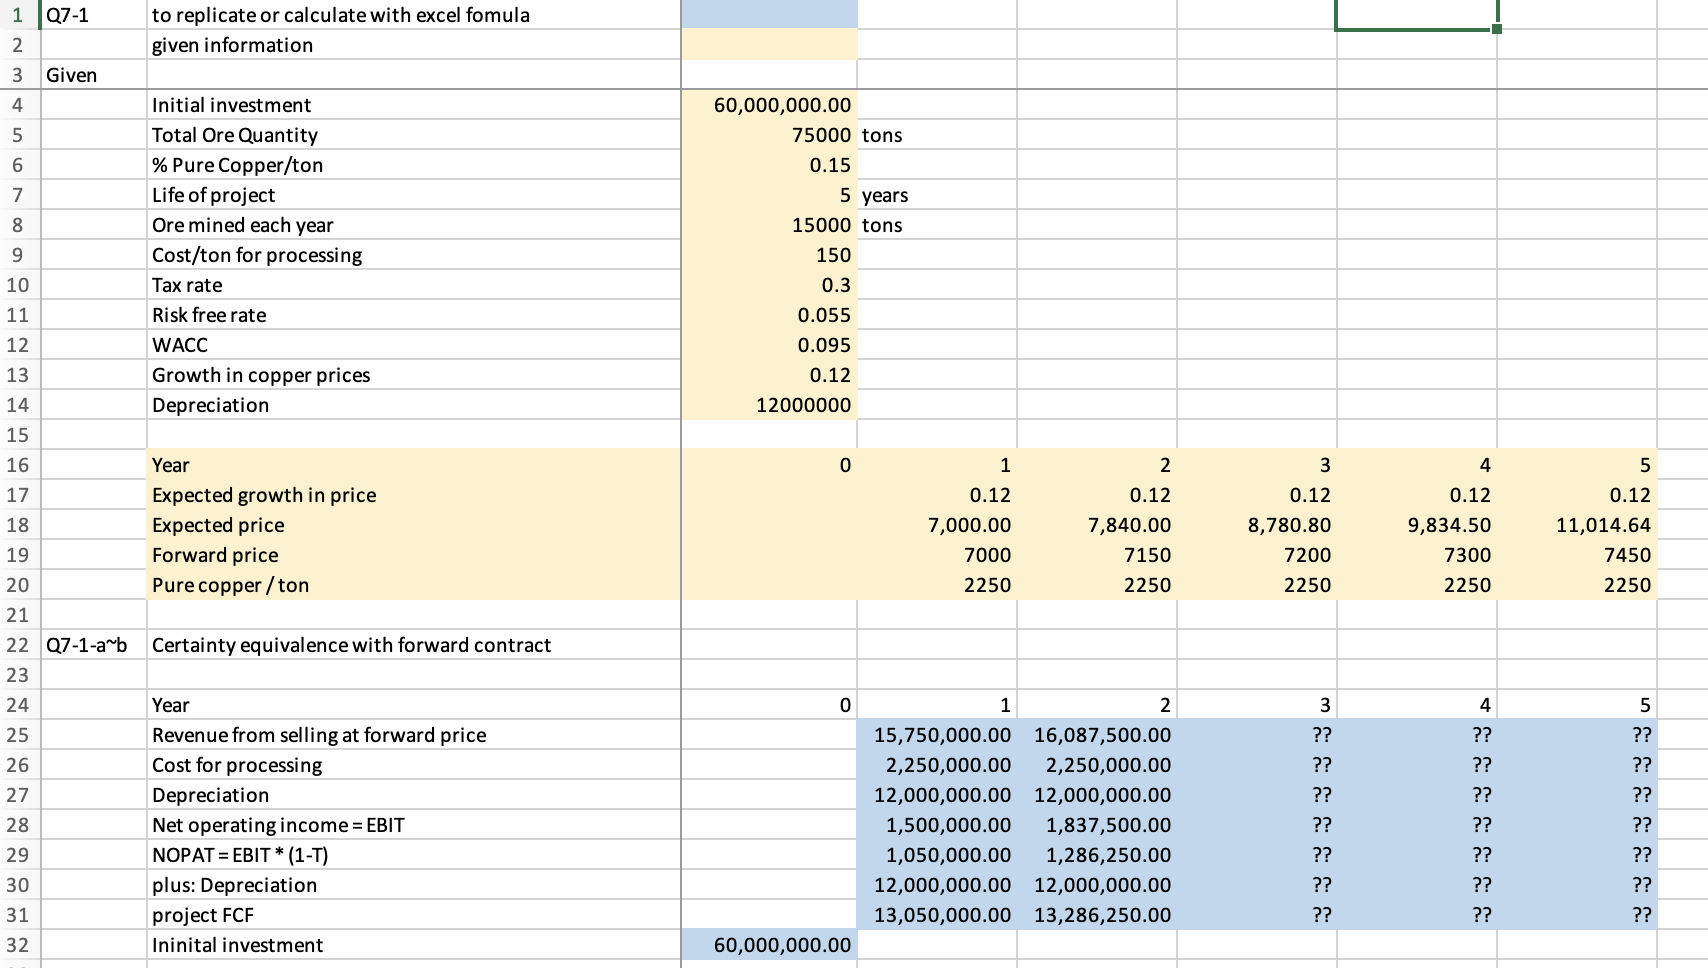
- Estimate the after-tax (certainty-equivalent) project free cash flows for the project over its five-year productive life.
- Using the certainty-equivalent valuation methodology, what is the NPV of the project?
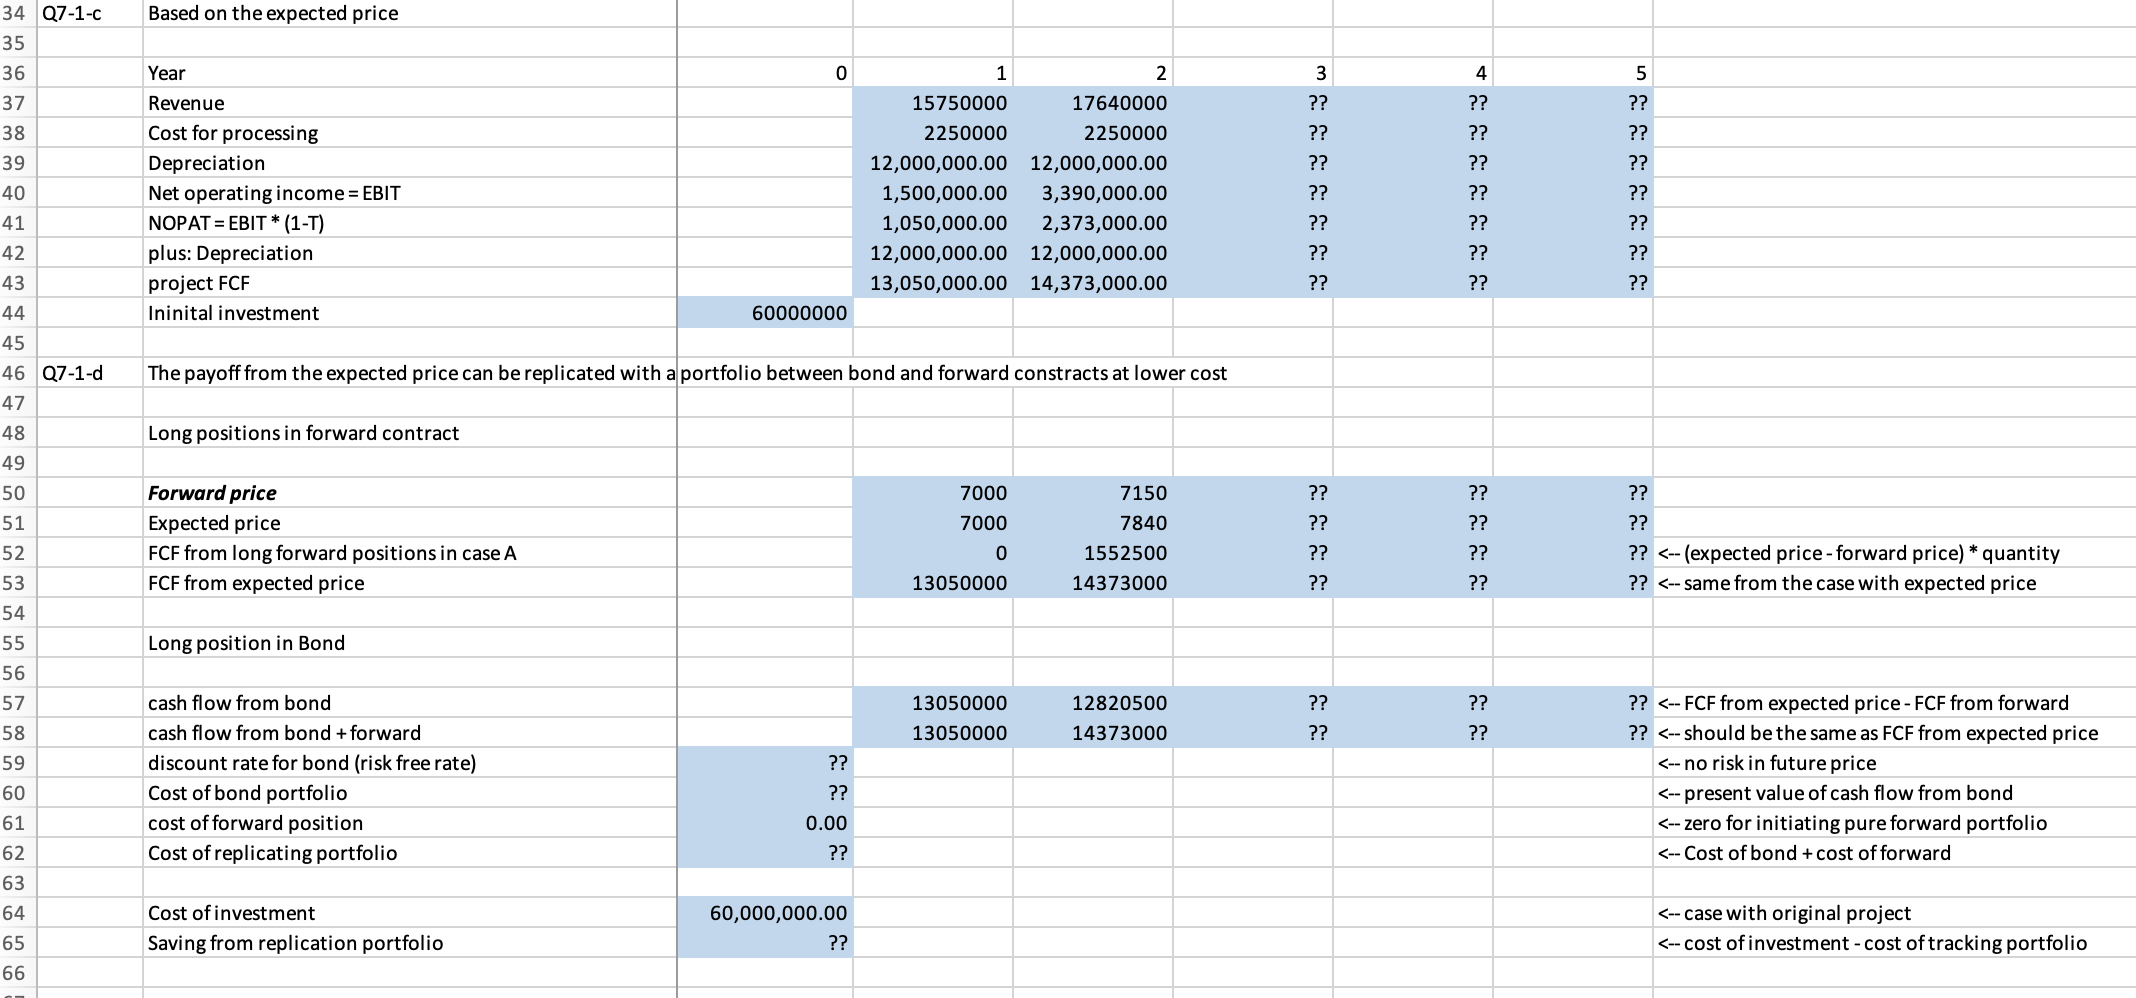
- Assume now that the analyst estimates the NPV of the project using the certainty-equivalent methodology and it is negative. When the firms CFO sees the results of the analysis, he suggests that something must be wrong because his own analysis using conventional methods (i.e., expected cash flows and the firms weighted average cost of capital) produces a positive NPV of more than $450,000. Specifically, he estimates that the price of copper for 2016 would indeed be $7,000 per ton but that this would increase by 12% per year over the five-year life of the project. How should the analyst respond to the CFOs concerns?
Hint: use a portfolio of financial asset (forward and bond) to replicate the cash flow from the cash flow from CEOs expectation.
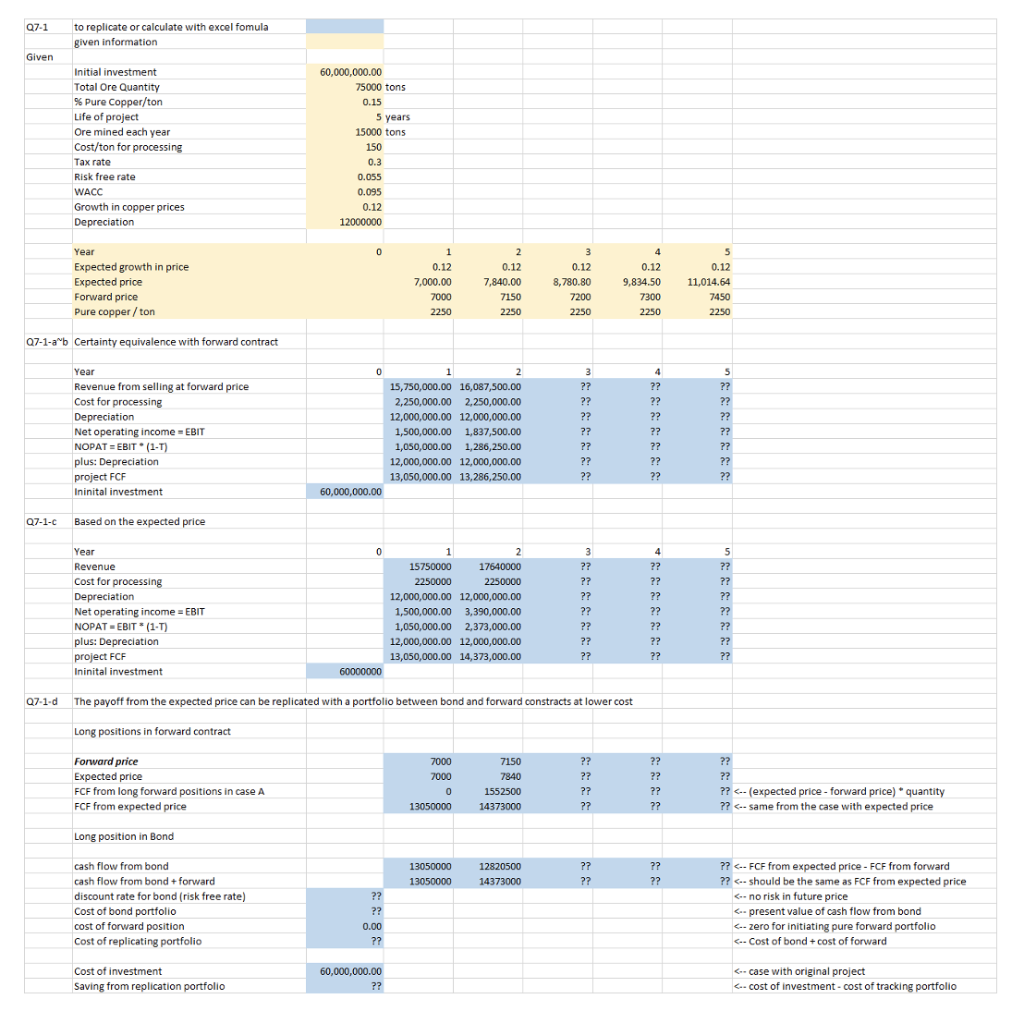
0 1 4 5 0.12 Year Expected growth in price Expected price Forward price Pure copper/ ton 0.12 7,000.00 7000 2 0.12 7,840.00 7150 2250 3 0.12 8,780.80 7200 2250 0.12 9,834.50 7300 2250 11,014.64 7450 2250 2250 Q7-1 to replicate or calculate with excel fomula given information Given Initial investment Total Ore Quantity % Pure Copper/ton Life of project Ore mined each year Cost/ton for processing Tax rate Risk free rate WACC Growth in copper prices Depreciation 60,000,000.00 75000 tons 0.15 5 years 15000 tons 150 0.3 0.055 0.095 0.12 12000000 0 4 Year Expected growth in price Expected price Forward price Pure copper / ton 0.12 7,000.00 7000 2250 2 0.12 7,840.00 7150 2250 3 0.12 8,780.80 7200 2250 0.12 9,834.50 7300 2250 5 0.12 11,014.64 7450 2250 07-1-ab Certainty equivalence with forward contract 0 Year Revenue from selling at forward price Cost for processing Depreciation Net operating income - EBIT NOPAT = EBIT (1-T) plus: Depreciation project FCF Ininital investment 2 15,750,000.00 16,087,500.00 2,250,000.00 2,250,000.00 12,000,000.00 12,000,000.00 1,500,000.00 1,837,500.00 1,050,000.00 1,286,250.00 12,000,000.00 12,000,000.00 13,050,000.00 13,286,250.00 3 ?? ?? ?? ?? ?? ?? ?? 4 ?? ?? ?? ?? ?? ?? ?? 5 ?? ?? ?? ?? ?? ?? ?? 60,000,000.00 27-1-C Based on the expected price 0 Year Revenue Cost for processing Depreciation Net operating income = EBIT NOPATEBIT*(1-T) plus: Depreciation project FCF Ininital investment 1 2 15750000 17640000 2250000 2250000 12,000,000.00 12,000,000.00 1,500,000.00 3,390,000.00 1,050,000.00 2,373,000.00 12,000,000.00 12,000,000.00 13,050,000.00 14,373,000.00 3 ?? ?? ?? ?? ?? ?? ?? 4 ?? ?? ?? ?? ?? ?? ?? 5 ?? ?? ?? ?? ?? ?? ?? 60000000 07-1.d The payoff from the expected price can be replicated with a portfolio between bond and forward constracts at lower cost Long positions in forward contract Forward price Expected price FCF from long forward positions in case A FCF from expected price 7000 7000 0 13050000 7150 7840 1552500 14373000 ?? ?? ?? ?? ?? ?? ?? ?? ?? ?? ?? (expected price - forward price) quantity ??
Step by Step Solution
There are 3 Steps involved in it

Get step-by-step solutions from verified subject matter experts