

Question: Q8 A firm that operates a large, direct-to-consumer sales force would like to implement a system to monitor the progress of new agents. A key
 Q8
Q8
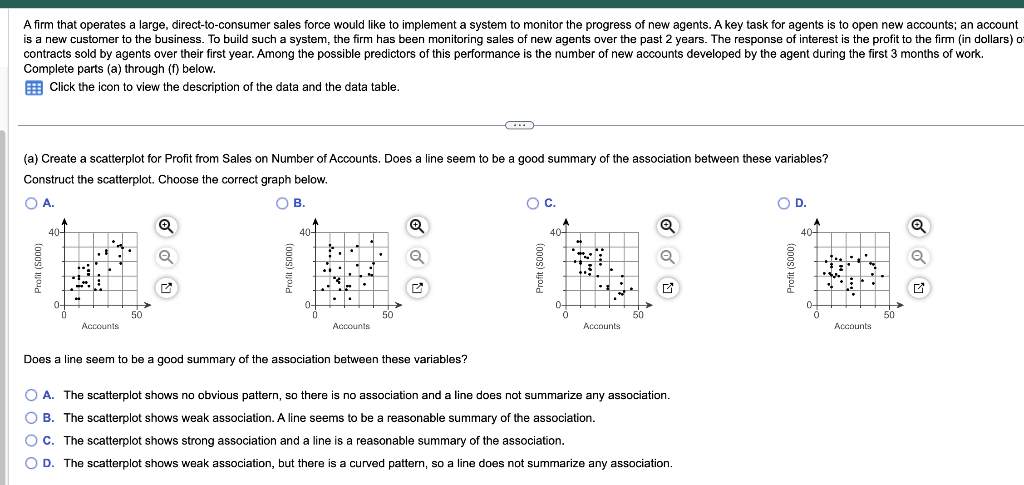
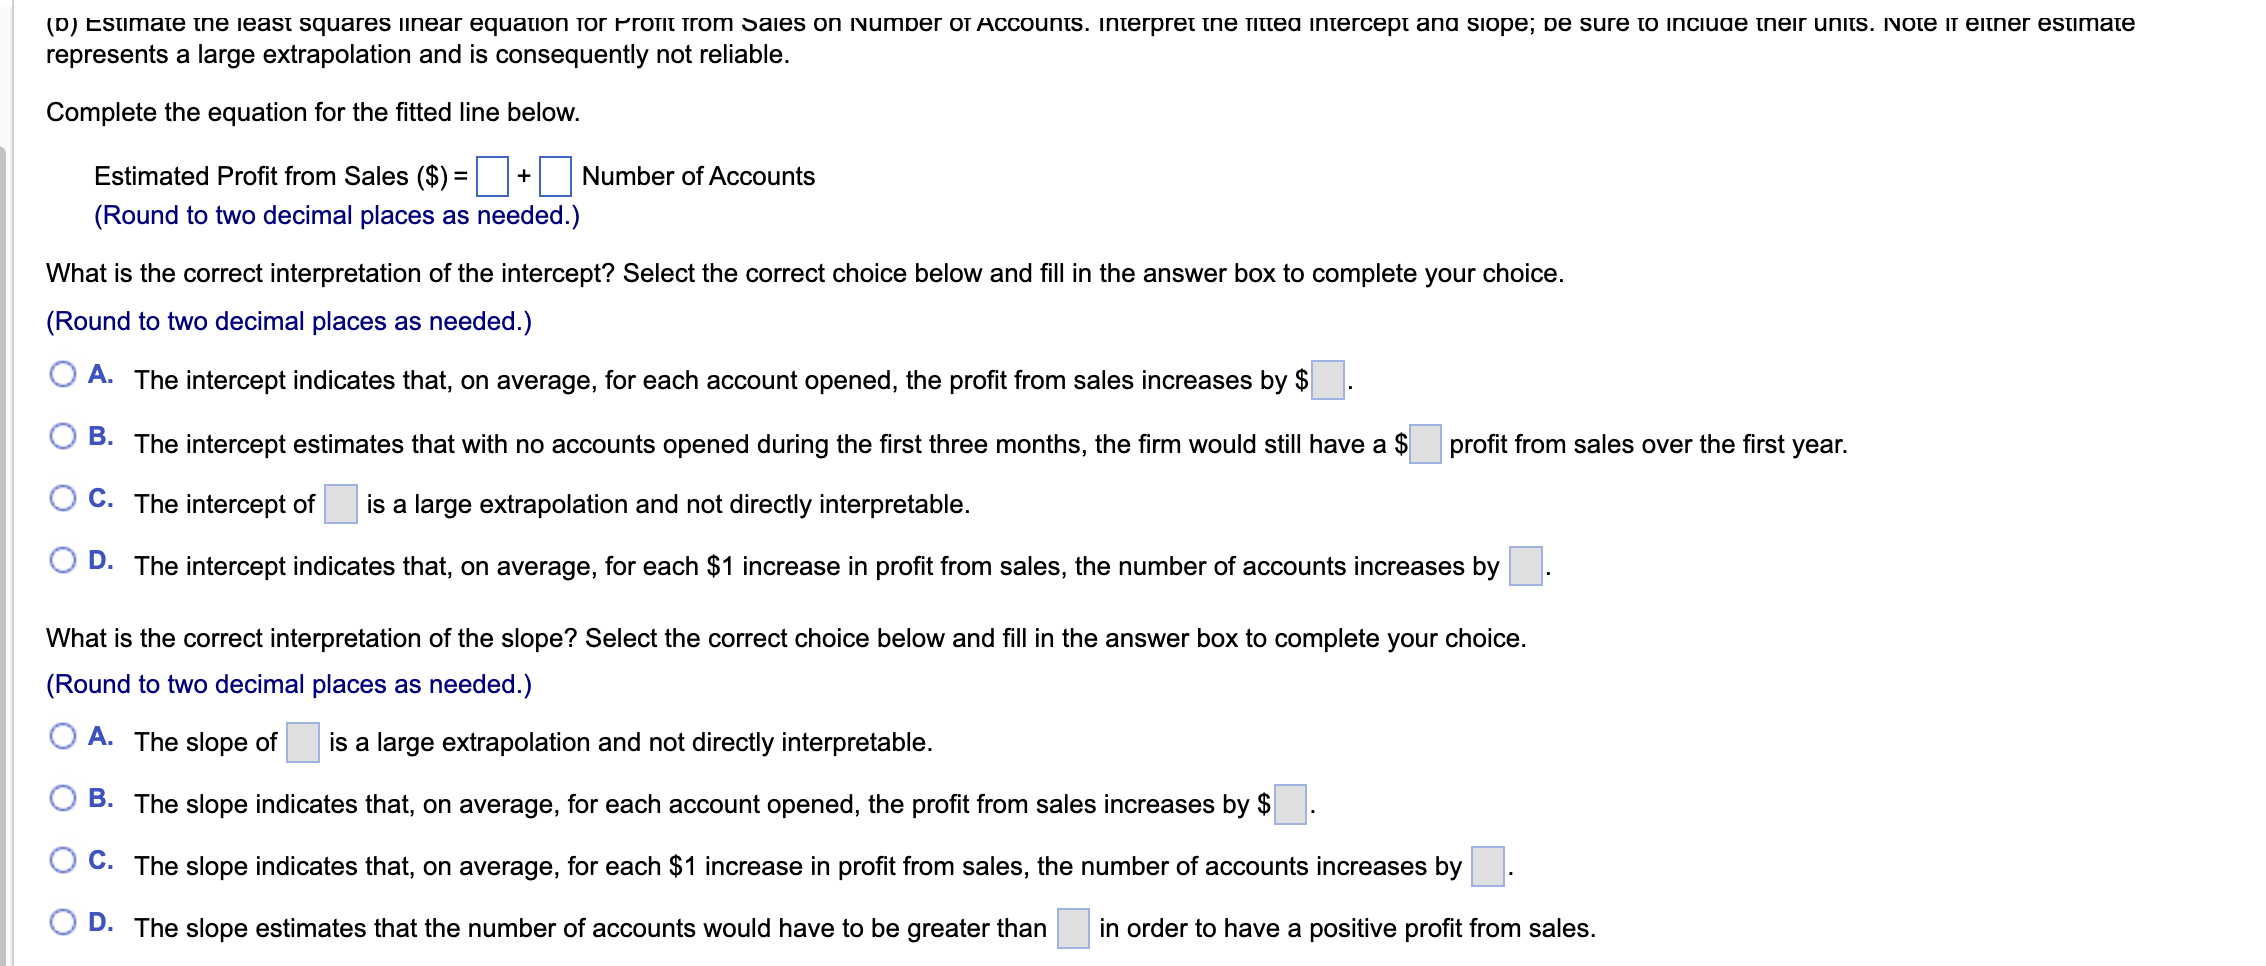
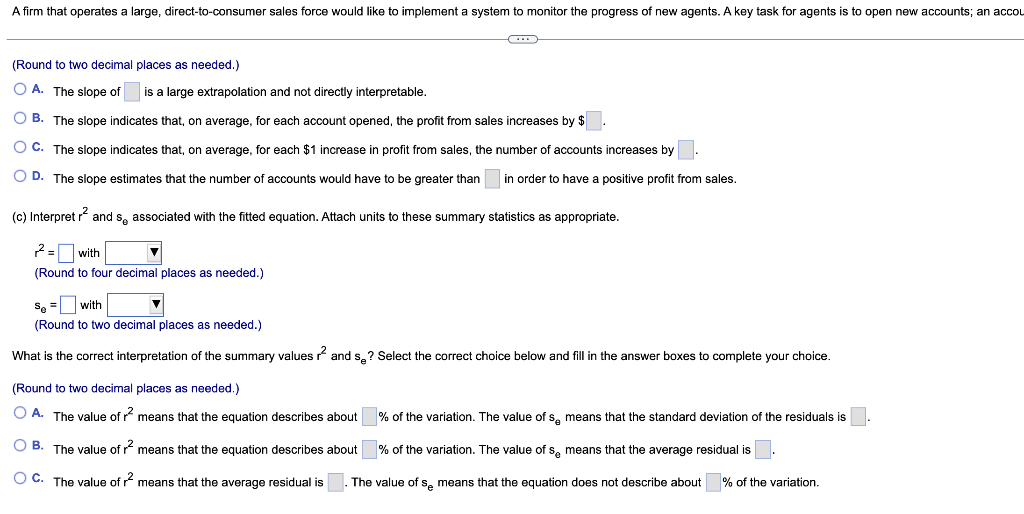
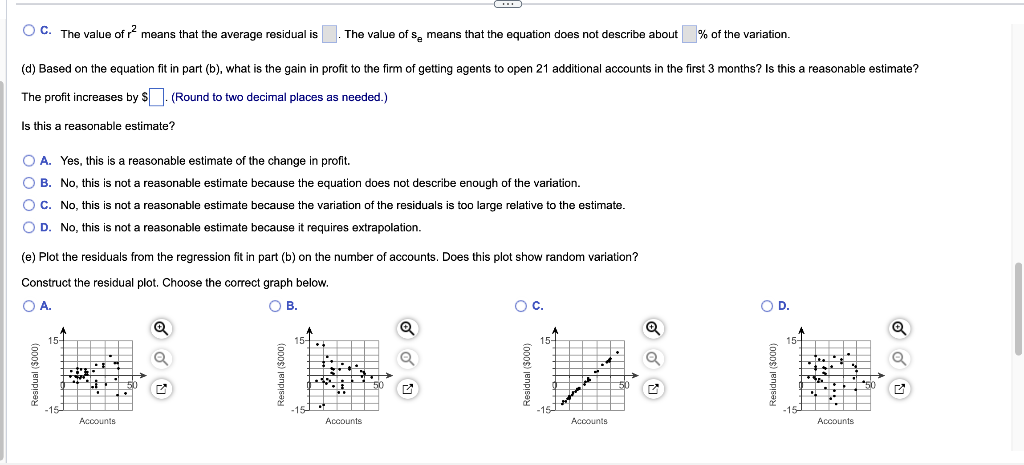
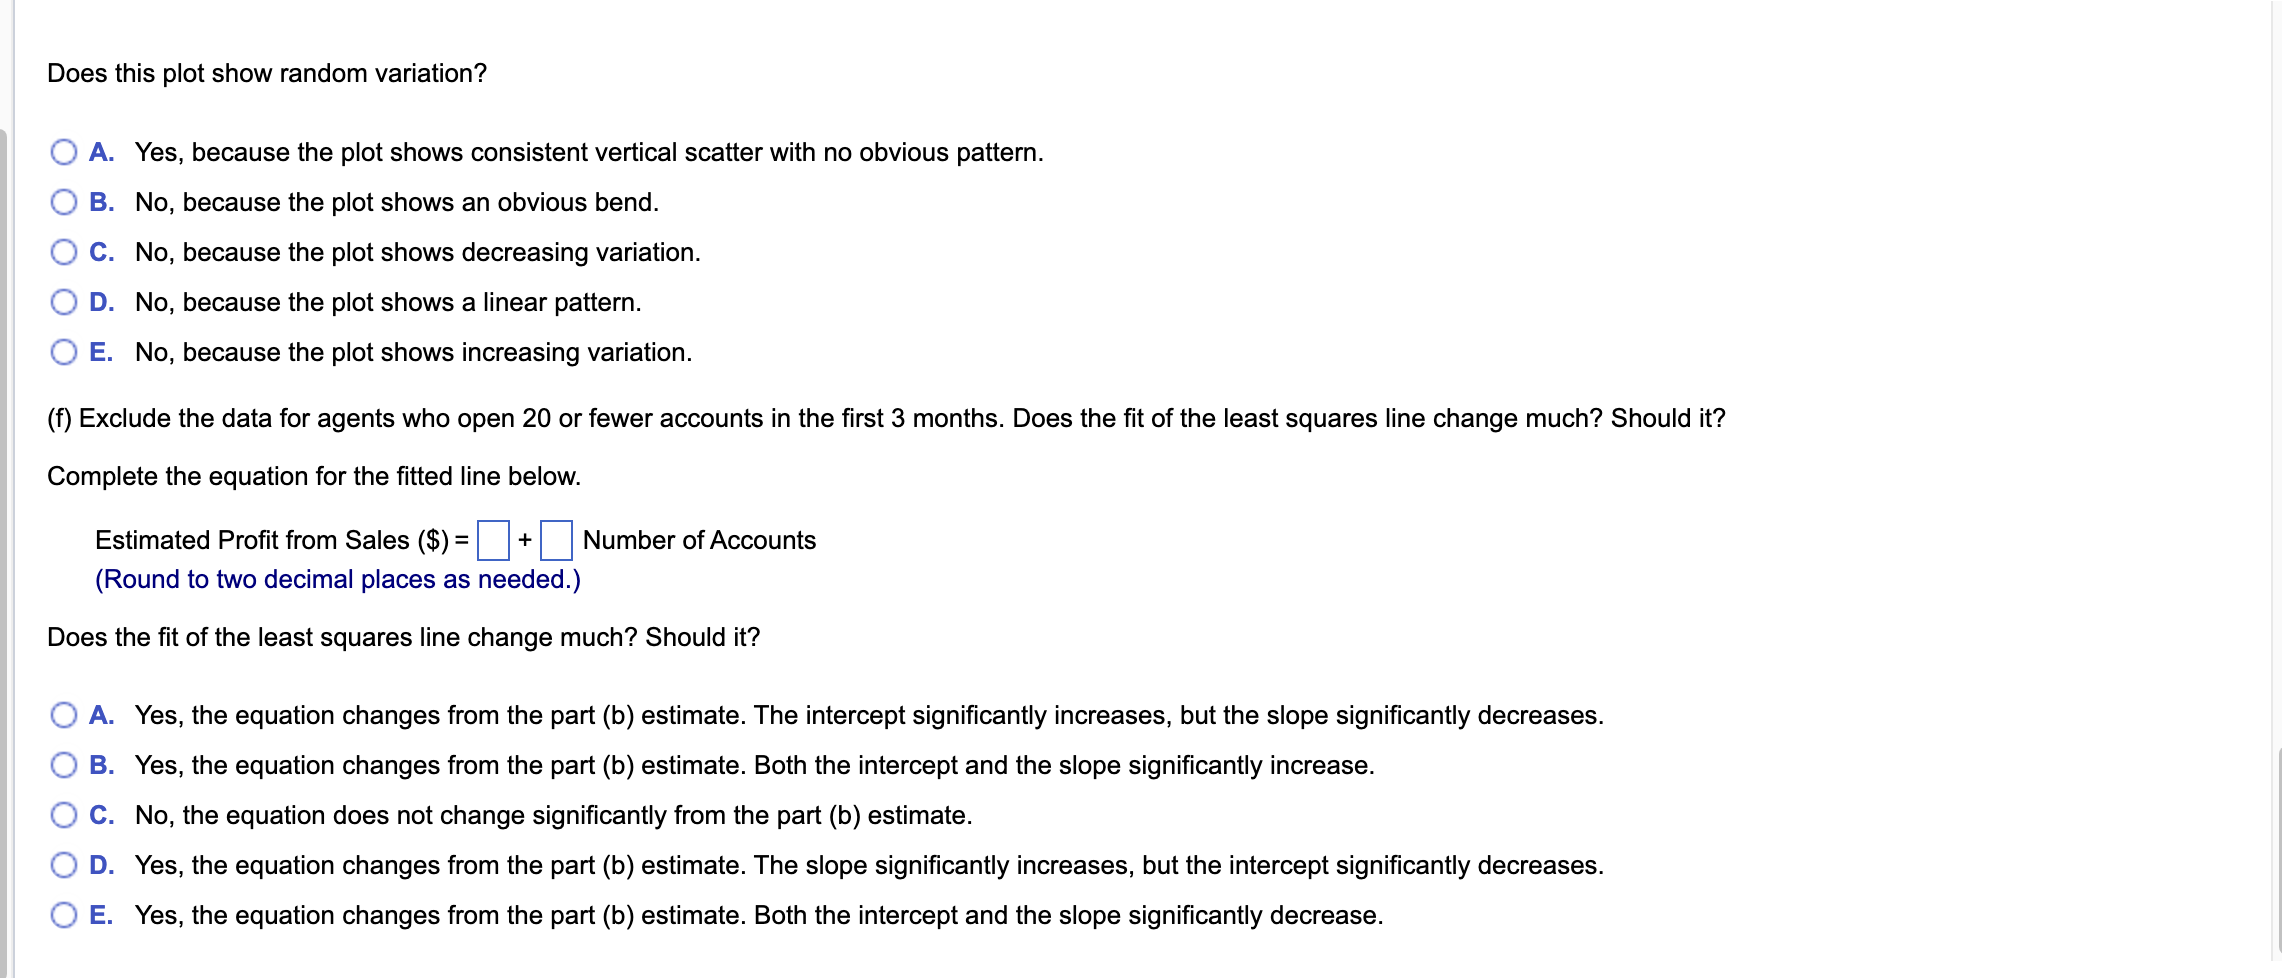
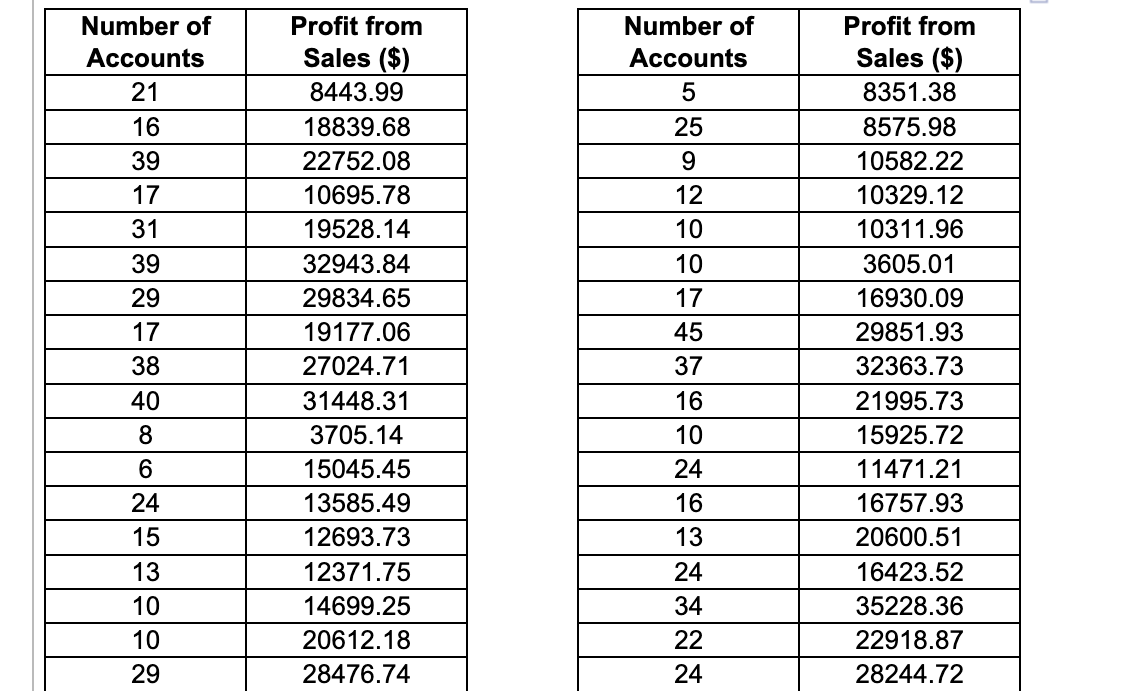
A firm that operates a large, direct-to-consumer sales force would like to implement a system to monitor the progress of new agents. A key task for agents is to open new accounts; an account is a new customer to the business. To build such a system, the firm has been monitoring sales of new agents over the past 2 years. The response of interest is the profit to the firm (in dollars) o contracts sold by agents over their first year. Among the possible predictors of this performance is the number of new accounts developed by the agent during the first 3 months of work. Complete parts (a) through (f) below. Click the icon to view the description of the data and the data table. (a) Create a scatterplot for Profit from Sales on Number of Accounts. Does a line seem to be a good summary of the association between these variables? Construct the scatterplot. Choose the correct graph below. A. B. c. D. Does a line seem to be a good summary of the association between these variables? A. The scatterplot shows no obvious pattern, so there is no association and a line does not summarize any association. B. The scatterplot shows weak association. A line seems to be a reasonable summary of the association. C. The scatterplot shows strong association and a line is a reasonable summary of the association. D. The scatterplot shows weak association, but there is a curved pattern, so a line does not summarize any association. represents a large extrapolation and is consequently not reliable. Complete the equation for the fitted line below. Estimated Profit from Sales ($)=1+ Number of Accounts (Round to two decimal places as needed.) What is the correct interpretation of the intercept? Select the correct choice below and fill in the answer box to complete your choice. (Round to two decimal places as needed.) A. The intercept indicates that, on average, for each account opened, the profit from sales increases by $ B. The intercept estimates that with no accounts opened during the first three months, the firm would still have a 9 profit from sales over the first year. C. The intercept of is a large extrapolation and not directly interpretable. D. The intercept indicates that, on average, for each $1 increase in profit from sales, the number of accounts increases What is the correct interpretation of the slope? Select the correct choice below and fill in the answer box complete your (Round to two decimal places as needed.) A. The slope of is a large extrapolation and not directly interpretable. B. The slope indicates that, on average, for each account opened, the profit from sales increases by $ C. The slope indicates that, on average, for each $1 increase in profit from sales, the number of accounts increases by D. The slope estimates that the number of accounts would have to be greater than in order to have a positive profit from sales. (Round to two decimal places as needed.) A. The slope of is a large extrapolation and not directly interpretable. B. The slope indicates that, on average, for each account opened, the profit from sales increases by $ C. The slope indicates that, on average, for each $1 increase in profit from sales, the number of accounts increases by D. The slope estimates that the number of accounts would have to be greater than in order to have a positive profit from sales. (c) Interpret r2 and s associated with the fitted equation. Attach units to these summary statistics as appropriate. r2=with (Round to four decimal places as needed.) se=with (Round to two decimal places as needed.) What is the correct interpretation of the summary values r2 and se ? Select the correct choice below and fill in the answer boxes to complete your choice. (Round to two decimal places as needed.) A. The value of r2 means that the equation describes about % of the variation. The value of se means that the standard deviation of the residuals is B. The value of r2 means that the equation describes about % of the variation. The value of se means that the average residual is C. The value of r2 means that the average residual is . The value of se means that the equation does not describe about % of the variation. C. The value of r2 means that the average residual is The value of se means that the equation does not describe about % of the variation. (d) Based on the equation fit in part (b), what is the gain in profit to the firm of getting agents to open 21 additional accounts in the first 3 months? Is this a reasonable estimate? The profit increases by \$ (Round to two decimal places as needed.) Is this a reasonable estimate? A. Yes, this is a reasonable estimate of the change in profit. B. No, this is not a reasonable estimate because the equation does not describe enough of the variation. C. No, this is not a reasonable estimate because the variation of the residuals is too large relative to the estimate. D. No, this is not a reasonable estimate because it requires extrapolation. (e) Plot the residuals from the regression fit in part (b) on the number of accounts. Does this plot show random variation? Construct the residual plot. Choose the correct graph below. A. B. c. D. Does this plot show random variation? A. Yes, because the plot shows consistent vertical scatter with no obvious pattern. B. No, because the plot shows an obvious bend. C. No, because the plot shows decreasing variation. D. No, because the plot shows a linear pattern. E. No, because the plot shows increasing variation. (f) Exclude the data for agents who open 20 or fewer accounts in the first 3 months. Does the fit of the least squares line change much? Should it? Complete the equation for the fitted line below. Estimated Profit from Sales (\$) Number of Accounts (Round to two decimal places as needed.) Does the fit of the least squares line change much? Should it? A. Yes, the equation changes from the part (b) estimate. The intercept significantly increases, but the slope significantly decreases. B. Yes, the equation changes from the part (b) estimate. Both the intercept and the slope significantly increase. C. No, the equation does not change significantly from the part (b) estimate. \begin{tabular}{|c|c|} \hline Number of Accounts & Profit from Sales ($) \\ \hline 21 & 8443.99 \\ \hline 16 & 18839.68 \\ \hline 39 & 22752.08 \\ \hline 17 & 10695.78 \\ \hline 31 & 19528.14 \\ \hline 39 & 32943.84 \\ \hline 29 & 29834.65 \\ \hline 17 & 19177.06 \\ \hline 38 & 27024.71 \\ \hline 40 & 31448.31 \\ \hline 8 & 3705.14 \\ \hline 6 & 15045.45 \\ \hline 24 & 13585.49 \\ \hline 15 & 12693.73 \\ \hline 13 & 12371.75 \\ \hline 10 & 14699.25 \\ \hline 10 & 20612.18 \\ \hline 29 & 28476.74 \\ \hline \end{tabular} \begin{tabular}{|c|c|} \hline Number of Accounts & Profit from Sales (\$) \\ \hline 5 & 8351.38 \\ \hline 25 & 8575.98 \\ \hline 9 & 10582.22 \\ \hline 12 & 10329.12 \\ \hline 10 & 10311.96 \\ \hline 10 & 3605.01 \\ \hline 17 & 16930.09 \\ \hline 45 & 29851.93 \\ \hline 37 & 32363.73 \\ \hline 16 & 21995.73 \\ \hline 10 & 15925.72 \\ \hline 24 & 11471.21 \\ \hline 16 & 16757.93 \\ \hline 13 & 20600.51 \\ \hline 24 & 16423.52 \\ \hline 34 & 35228.36 \\ \hline 22 & 22918.87 \\ \hline 24 & 28244.72 \\ \hline \end{tabular} A firm that operates a large, direct-to-consumer sales force would like to implement a system to monitor the progress of new agents. A key task for agents is to open new accounts; an account is a new customer to the business. To build such a system, the firm has been monitoring sales of new agents over the past 2 years. The response of interest is the profit to the firm (in dollars) o contracts sold by agents over their first year. Among the possible predictors of this performance is the number of new accounts developed by the agent during the first 3 months of work. Complete parts (a) through (f) below. Click the icon to view the description of the data and the data table. (a) Create a scatterplot for Profit from Sales on Number of Accounts. Does a line seem to be a good summary of the association between these variables? Construct the scatterplot. Choose the correct graph below. A. B. c. D. Does a line seem to be a good summary of the association between these variables? A. The scatterplot shows no obvious pattern, so there is no association and a line does not summarize any association. B. The scatterplot shows weak association. A line seems to be a reasonable summary of the association. C. The scatterplot shows strong association and a line is a reasonable summary of the association. D. The scatterplot shows weak association, but there is a curved pattern, so a line does not summarize any association. represents a large extrapolation and is consequently not reliable. Complete the equation for the fitted line below. Estimated Profit from Sales ($)=1+ Number of Accounts (Round to two decimal places as needed.) What is the correct interpretation of the intercept? Select the correct choice below and fill in the answer box to complete your choice. (Round to two decimal places as needed.) A. The intercept indicates that, on average, for each account opened, the profit from sales increases by $ B. The intercept estimates that with no accounts opened during the first three months, the firm would still have a 9 profit from sales over the first year. C. The intercept of is a large extrapolation and not directly interpretable. D. The intercept indicates that, on average, for each $1 increase in profit from sales, the number of accounts increases What is the correct interpretation of the slope? Select the correct choice below and fill in the answer box complete your (Round to two decimal places as needed.) A. The slope of is a large extrapolation and not directly interpretable. B. The slope indicates that, on average, for each account opened, the profit from sales increases by $ C. The slope indicates that, on average, for each $1 increase in profit from sales, the number of accounts increases by D. The slope estimates that the number of accounts would have to be greater than in order to have a positive profit from sales. (Round to two decimal places as needed.) A. The slope of is a large extrapolation and not directly interpretable. B. The slope indicates that, on average, for each account opened, the profit from sales increases by $ C. The slope indicates that, on average, for each $1 increase in profit from sales, the number of accounts increases by D. The slope estimates that the number of accounts would have to be greater than in order to have a positive profit from sales. (c) Interpret r2 and s associated with the fitted equation. Attach units to these summary statistics as appropriate. r2=with (Round to four decimal places as needed.) se=with (Round to two decimal places as needed.) What is the correct interpretation of the summary values r2 and se ? Select the correct choice below and fill in the answer boxes to complete your choice. (Round to two decimal places as needed.) A. The value of r2 means that the equation describes about % of the variation. The value of se means that the standard deviation of the residuals is B. The value of r2 means that the equation describes about % of the variation. The value of se means that the average residual is C. The value of r2 means that the average residual is . The value of se means that the equation does not describe about % of the variation. C. The value of r2 means that the average residual is The value of se means that the equation does not describe about % of the variation. (d) Based on the equation fit in part (b), what is the gain in profit to the firm of getting agents to open 21 additional accounts in the first 3 months? Is this a reasonable estimate? The profit increases by \$ (Round to two decimal places as needed.) Is this a reasonable estimate? A. Yes, this is a reasonable estimate of the change in profit. B. No, this is not a reasonable estimate because the equation does not describe enough of the variation. C. No, this is not a reasonable estimate because the variation of the residuals is too large relative to the estimate. D. No, this is not a reasonable estimate because it requires extrapolation. (e) Plot the residuals from the regression fit in part (b) on the number of accounts. Does this plot show random variation? Construct the residual plot. Choose the correct graph below. A. B. c. D. Does this plot show random variation? A. Yes, because the plot shows consistent vertical scatter with no obvious pattern. B. No, because the plot shows an obvious bend. C. No, because the plot shows decreasing variation. D. No, because the plot shows a linear pattern. E. No, because the plot shows increasing variation. (f) Exclude the data for agents who open 20 or fewer accounts in the first 3 months. Does the fit of the least squares line change much? Should it? Complete the equation for the fitted line below. Estimated Profit from Sales (\$) Number of Accounts (Round to two decimal places as needed.) Does the fit of the least squares line change much? Should it? A. Yes, the equation changes from the part (b) estimate. The intercept significantly increases, but the slope significantly decreases. B. Yes, the equation changes from the part (b) estimate. Both the intercept and the slope significantly increase. C. No, the equation does not change significantly from the part (b) estimate. \begin{tabular}{|c|c|} \hline Number of Accounts & Profit from Sales ($) \\ \hline 21 & 8443.99 \\ \hline 16 & 18839.68 \\ \hline 39 & 22752.08 \\ \hline 17 & 10695.78 \\ \hline 31 & 19528.14 \\ \hline 39 & 32943.84 \\ \hline 29 & 29834.65 \\ \hline 17 & 19177.06 \\ \hline 38 & 27024.71 \\ \hline 40 & 31448.31 \\ \hline 8 & 3705.14 \\ \hline 6 & 15045.45 \\ \hline 24 & 13585.49 \\ \hline 15 & 12693.73 \\ \hline 13 & 12371.75 \\ \hline 10 & 14699.25 \\ \hline 10 & 20612.18 \\ \hline 29 & 28476.74 \\ \hline \end{tabular} \begin{tabular}{|c|c|} \hline Number of Accounts & Profit from Sales (\$) \\ \hline 5 & 8351.38 \\ \hline 25 & 8575.98 \\ \hline 9 & 10582.22 \\ \hline 12 & 10329.12 \\ \hline 10 & 10311.96 \\ \hline 10 & 3605.01 \\ \hline 17 & 16930.09 \\ \hline 45 & 29851.93 \\ \hline 37 & 32363.73 \\ \hline 16 & 21995.73 \\ \hline 10 & 15925.72 \\ \hline 24 & 11471.21 \\ \hline 16 & 16757.93 \\ \hline 13 & 20600.51 \\ \hline 24 & 16423.52 \\ \hline 34 & 35228.36 \\ \hline 22 & 22918.87 \\ \hline 24 & 28244.72 \\ \hline \end{tabular}
Step by Step Solution
There are 3 Steps involved in it

Get step-by-step solutions from verified subject matter experts