

Question: q9 The following data for the dependent variable y, and the independent variable x, have been Correlation Rubric: collected using simple random sampling: Negative -1
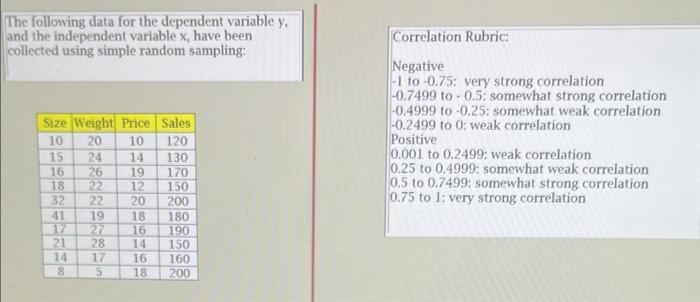
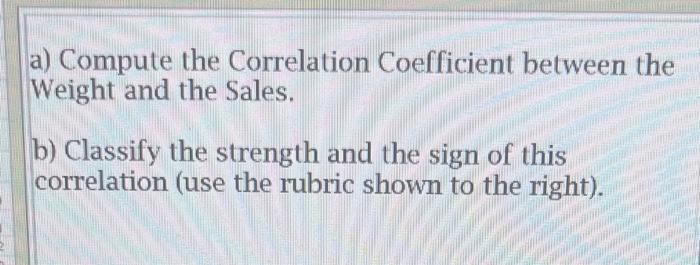
The following data for the dependent variable y, and the independent variable x, have been Correlation Rubric: collected using simple random sampling: Negative -1 to -0.75 : very strong correlation -0.7499 to -0.5 : somewhat strong correlation -0.4999 to -0.25 : somewhat weak correlation -0.2499 to 0 : weak correlation Positive 0.001 to 0.2499 : weak correlation 0.25 to 0.4999 : somewhat weak correlation 0.5 to 0.7499 : somewhat strong correlation 0.75 to l: very strong correlation a) Compute the Correlation Coefficient between the Weight and the Sales. b) Classify the strength and the sign of this correlation (use the rubric shown to the right)
Step by Step Solution
There are 3 Steps involved in it

Get step-by-step solutions from verified subject matter experts