

Question: QI. Consider the following two separate samples. 27 27 25 12 15 10 20 37 31 35 and 1 3 2 16 18 16 16
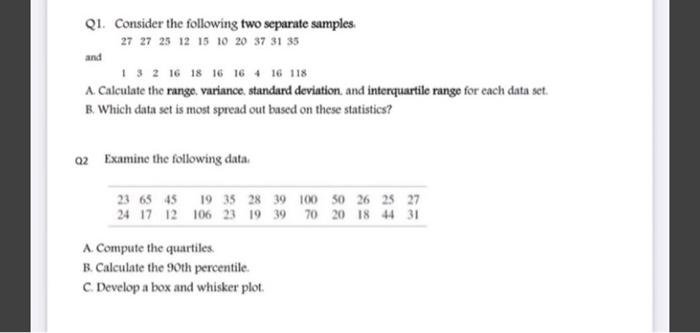
QI. Consider the following two separate samples. 27 27 25 12 15 10 20 37 31 35 and 1 3 2 16 18 16 16 4 16 118 A. Calculate the range, variance, standard deviation, and interquartile range for each data set. B. Which data set is most spread out based on these statistics? 02 Examine the following data 23 65 45 19 35 28 39 100 50 26 25 27 24 17 12 106 23 19 39 70 20 18 44 31 A. Compute the quartiles B. Calculate the 90th percentile. C Develop a box and whisker plot
Step by Step Solution
There are 3 Steps involved in it
1 Expert Approved Answer
Step: 1 Unlock

Question Has Been Solved by an Expert!
Get step-by-step solutions from verified subject matter experts
Step: 2 Unlock
Step: 3 Unlock