

Question: Q1. The graph below plots the oxygen saturation curves for hemoglobin under different conditions. The solid curve represents the curve observed under physiological conditions.
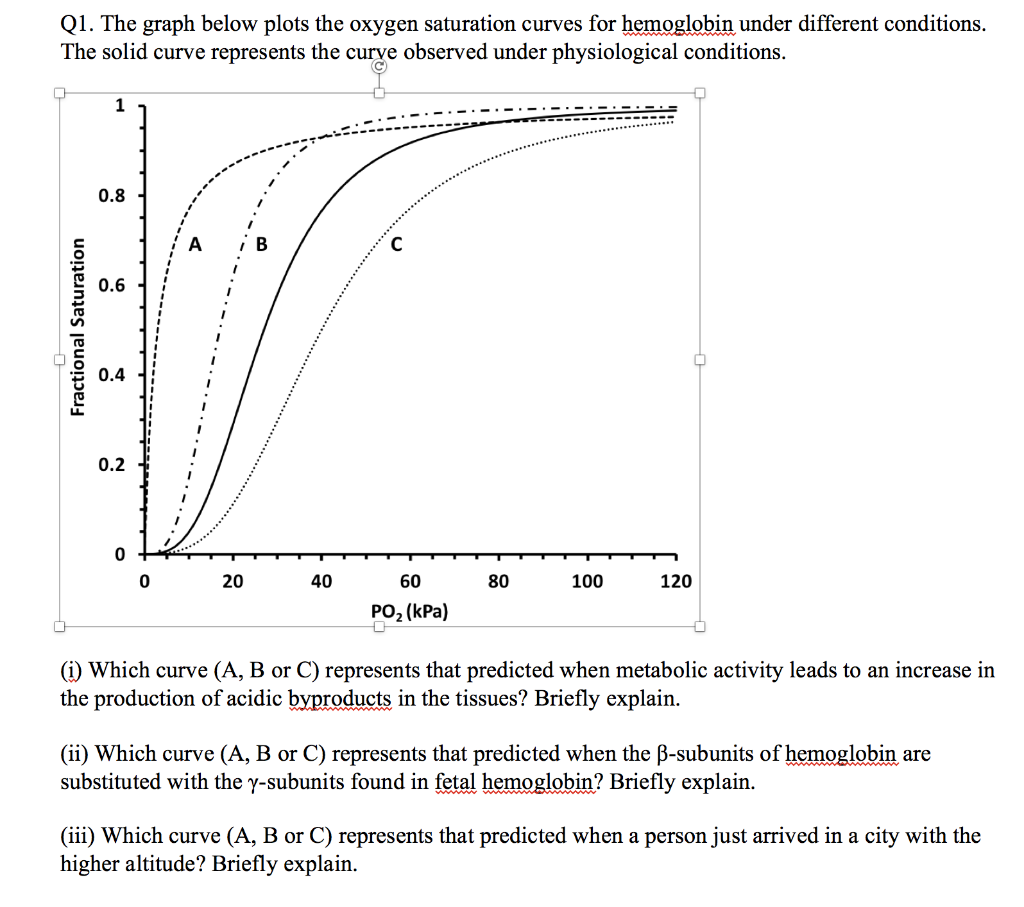
Q1. The graph below plots the oxygen saturation curves for hemoglobin under different conditions. The solid curve represents the curve observed under physiological conditions. C Fractional Saturation 1 0.8 0.6 0.4 0.2 0 20 40 60 PO (kPa) 80 100 120 0 (i) Which curve (A, B or C) represents that predicted when metabolic activity leads to an increase in the production of acidic byproducts in the tissues? Briefly explain. (ii) Which curve (A, B or C) represents that predicted when the -subunits of hemoglobin are substituted with the y-subunits found in fetal hemoglobin? Briefly explain. (iii) Which curve (A, B or C) represents that predicted when a person just arrived in a city with the higher altitude? Briefly explain.
Step by Step Solution
3.42 Rating (158 Votes )
There are 3 Steps involved in it
To answer the questions about the oxygen saturation curves for hemoglobin we need to understand how ... View full answer

Get step-by-step solutions from verified subject matter experts