

Question: Ql) ................................................................................................ 8 marks The data. in the table below are 60 smiling times, in seconds, of a. four-weekold baby. 12.?7 18.25 13.52 11.55 10.14
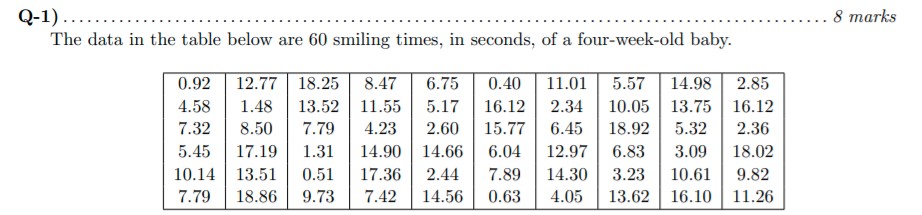


Ql) ................................................................................................ 8 marks The data. in the table below are 60 smiling times, in seconds, of a. four-weekold baby. 12.?7 18.25 13.52 11.55 10.14 13.51 (a) (2 pts) Construct a histogram using SPSS. Which theoretical distribution fairly approximates the histogram of this empirical distribution? Why?(b) (2 pts} We will assume that the smiling times, in seconds, follow a uniform distribution between zero and 20 seconds, inclusive. This means that an},r smiling time from zero to and including 20 seconds is equale likely. State the values of c and d. Write the distribution in proper notation? and calculate the theoretical mean and standard deviation. (c) (2 pts) What is the probability that a randomly chosen four-week-old baby smiles between five and ten seconds?(d) (2 pts) 80% of the time, a randomly selected baby would smile below What value
Step by Step Solution
There are 3 Steps involved in it

Get step-by-step solutions from verified subject matter experts