

Question: QM SEC B QUESTION 7,8,9 PLS HELP ME TO SOLVE THIS QUESTION. THIS IS QUANTATIVE METHOD TEST 7. At a local college, 55 female students
QM SEC B QUESTION 7,8,9 PLS HELP ME TO SOLVE THIS QUESTION. THIS IS QUANTATIVE METHOD TEST
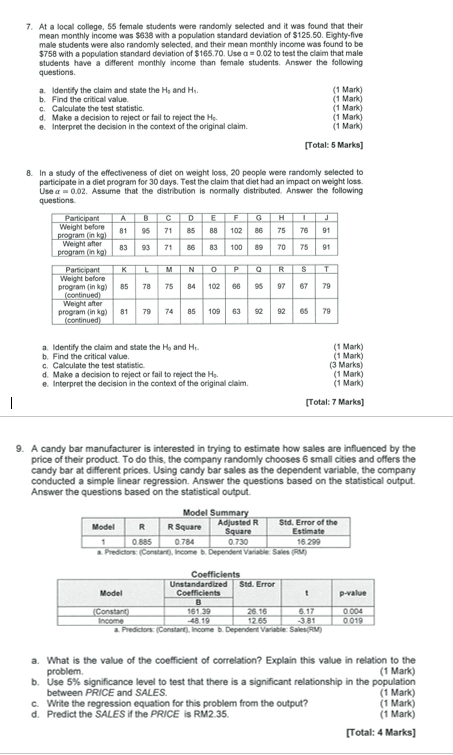
7. At a local college, 55 female students were randomly selected and it was found that their mean monthly income was $636 with a population standard deviation of $125.50. Eighty-five male students were also randomly solected, and their mean monthly income was found to be $758 with a population standard deviation of $165.70. Use a=0.02 to test the claim that male students have a different monthly income than female students. Answer the following questions. a. Identify the claim and state the H5 and H4. b. Find the critical value. c. Calculate the test statistic. d. Make a decision to reject or fail to reject the He. e. Interpret the decision in the context of the original claim. (1 Mark) (1) Mark) (1 Mark) (1 Mark) (1 Mark) [Total: 5 Marks] 8. In a study of the effectheness of diet on weight loss. 20 people were randomly selected to participate in a diet program for 30 days. Test the claim that diet had an impact on weight loss. Use a=0.02. Assume that the distributice is normally distributed. Answer the following questions. a. Identify the claim and state the H2 and HL. b. Find the critical value. c. Calculate the test statistic. d. Make a decision to reject or fail to reject the H2. e. Interpret the decision in the context of the original claim. [Total: 7 Marks] 9. A candy bar manufacturer is interested in trying to estimate how sales are influenced by the price of their product. To do this, the company randomly chooses 6 small cities and offers the candy bar at different prices. Using candy bar sales as the dependent variable, the company conducted a simple linear regression. Answer the questions based on the statistical output. Answer the questions based on the statistical output. a. What is the value of the coefficient of correlation? Explain this value in relation to the problem. b. Use 5% significance level to test that there is a significant relationship in the population between PRICE and SALES. c. Write the regression equation for this problem from the output? (1 Mark) d. Predict the SALES if the PRICE is RM2.35. (1 Mark) 7. At a local college, 55 female students were randomly selected and it was found that their mean monthly income was $636 with a population standard deviation of $125.50. Eighty-five male students were also randomly solected, and their mean monthly income was found to be $758 with a population standard deviation of $165.70. Use a=0.02 to test the claim that male students have a different monthly income than female students. Answer the following questions. a. Identify the claim and state the H5 and H4. b. Find the critical value. c. Calculate the test statistic. d. Make a decision to reject or fail to reject the He. e. Interpret the decision in the context of the original claim. (1 Mark) (1) Mark) (1 Mark) (1 Mark) (1 Mark) [Total: 5 Marks] 8. In a study of the effectheness of diet on weight loss. 20 people were randomly selected to participate in a diet program for 30 days. Test the claim that diet had an impact on weight loss. Use a=0.02. Assume that the distributice is normally distributed. Answer the following questions. a. Identify the claim and state the H2 and HL. b. Find the critical value. c. Calculate the test statistic. d. Make a decision to reject or fail to reject the H2. e. Interpret the decision in the context of the original claim. [Total: 7 Marks] 9. A candy bar manufacturer is interested in trying to estimate how sales are influenced by the price of their product. To do this, the company randomly chooses 6 small cities and offers the candy bar at different prices. Using candy bar sales as the dependent variable, the company conducted a simple linear regression. Answer the questions based on the statistical output. Answer the questions based on the statistical output. a. What is the value of the coefficient of correlation? Explain this value in relation to the problem. b. Use 5% significance level to test that there is a significant relationship in the population between PRICE and SALES. c. Write the regression equation for this problem from the output? (1 Mark) d. Predict the SALES if the PRICE is RM2.35. (1 Mark)
Step by Step Solution
There are 3 Steps involved in it

Get step-by-step solutions from verified subject matter experts