

Question: A QSAR analysis was carried out for a series of N-methylphthalimides as antitussive agents. The multiple regression analysis returned the following model: Substituent CN
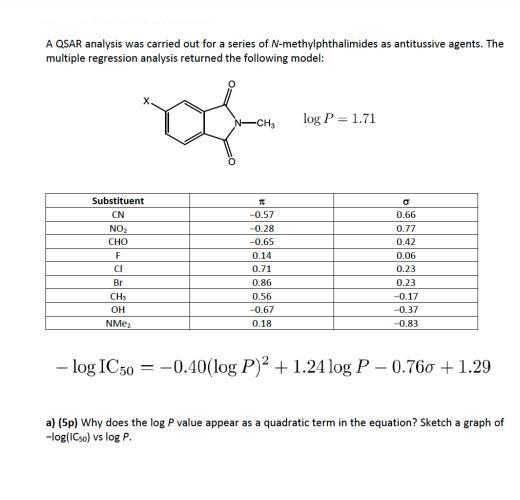
A QSAR analysis was carried out for a series of N-methylphthalimides as antitussive agents. The multiple regression analysis returned the following model: Substituent CN NO CHO F CI Br CHS OH NMe N-CH T -0.57 -0.28 -0.65 0.14 0.71 0.86 0.56 -0.67 0.18 log P 1.71 = 0.66 0.77 0.42 0.06 0.23 0.23 -0.17 -0.37 -0.83 - log IC 50 = -0.40(log P) + 1.24 log P - 0.760 + 1.29 a) (5p) Why does the log P value appear as a quadratic term in the equation? Sketch a graph of -log(ICso) vs log P. b) (10p) What is the predicted optimal value of log P for this series of compounds? c) (5p) What does the coefficient value on the o parameter mean? Describe the effect of sigma on the activity. d) (5p) What is the predicted IC50 value of N-methylphthalimide (i.e. with H as substituent)?
Step by Step Solution
3.33 Rating (153 Votes )
There are 3 Steps involved in it
a The log P value appears as a quadratic term in the equation because the effect of lipophilicity on ... View full answer

Get step-by-step solutions from verified subject matter experts